
Bulls Sent Scampering for Safety as BTC is Hammered in Overnight Sell-off: Oct. 11
Oct 11, 2018, 11:35AMAfter weeks of being stuck in tight ranges BTC took a major plunge downwards, as predicted, losing close to $300 in overnight trading
For weeks we have been reporting that many of the cryptocurrencies had been stuck in tight ranges, and suggested that Bitcoin was ripe for a major breakout, with a much higher probability for it going south rather than north. Overnight trade scenarios indicate these predictions were valid, as Bitcoin and several major cryptos took a major plunge downwards. So what should traders do now that all-around bearishness has hit the markets?
BTC/USD
Bitcoin lost close to $300 in overnight trading after breaking out of the medium term symmetrical triangle to the downside. This can be seen on the daily chart below. BTC/USD is presently struggling to hover above the $6,200 mark, where it has found support on the daily chart. Despite the sell-off, we are still within the confines of the picture seen in the weekly chart, which shows that the floor of Bitcoin remains at the $5,700 - $5,800 mark on the weekly chart, and $6,200 on the daily chart.
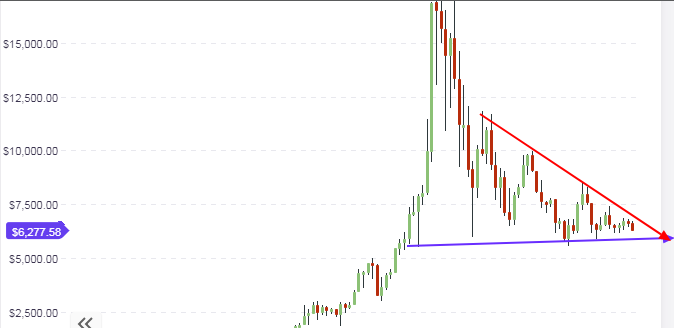
This shows that as far as the long-term focus for BTC/USD is concerned, there is still room for more downside movement if the $6,200 support line on the daily chart is broken to the downside. Presently, the daily chart support of $6,200 is holding up well. This support level would need to be violated and broken comprehensively for us to see further slide down to the $5,800 long-term support area.
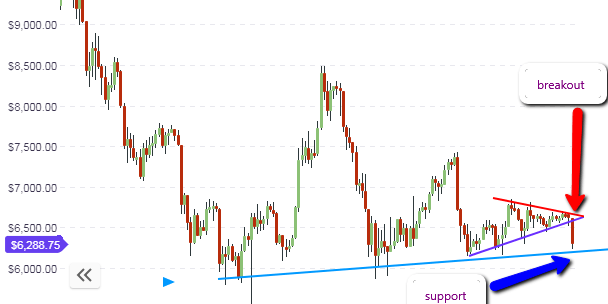
The daily chart will be the main focus for trade decisions as far as medium-term price analysis is concerned. Intraday trading is going to be very risky as the price of BTC will continue to make some choppy short term movements. All the pivot point support lines (S1 to S3) have all been breached, which does not provide a reasonable floor for any bounce trades to the upside. Intraday traders are therefore advised to avoid using short term bases for setting up trades, and instead use the daily chart as their beacon.
Further trades will have to depend on what happens at the $6,200 support area. If it is broken with a 3% breakout penetration to the downside, then it is best to trade short on any pullbacks to the broken support. If this is not the case, then traders should wait for possible rallies to the broken support areas where they can sell on the rally peaks.
Outlook for BTC/USD
- Long-term: neutral to bearish
- Medium-term: bearish
- Short-term: bearish
XLM/USD
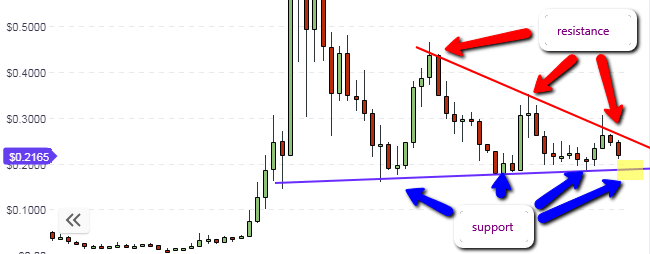
The XLM/USD pair has not been left out of the sell-off, being dragged down by the slump in Bitcoin price in overnight trading. The current weekly candle is now bearish, and is pushing towards the support line at 19 cents area. The chart below shows that there is still room for further downside.
The daily chart for XLM/USD shows a clearer picture. We see the initial support that formed from previous price action (black horizontal line), which was now broken by the current daily candle which showcases the bearish price action of overnight trading for the day. However, price action has found support at the blue support line, located at the 22 cents area. You can see that this line was a previous support, was broken by upside movement a few weeks ago, and has now become the support once more. This is going to be the key level that must be broken for price action to make the move down to the next support line at 19 cents, which is also the site of the support line on the weekly chart.
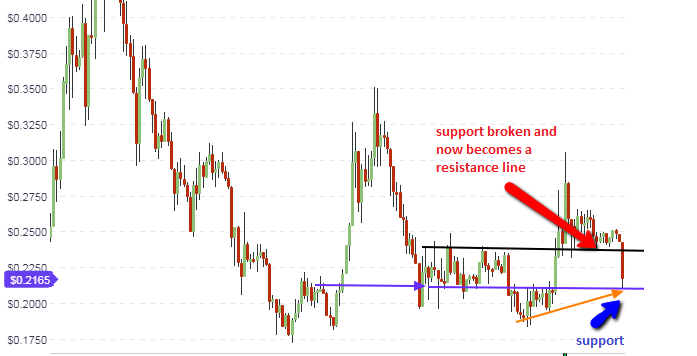
If the price fails to break the 22 cents support line on the daily chart, then we expect a short term rally to the 24 cents support-turned resistance line (black horizontal line). If the bearish sentiment continues to weigh down on Stellar Lumens, selling on the rally to the 24 cents support may be an option, depending on whether the candle that takes the price to that area finds resistance at that area.
Intraday pivot levels that provide support have all been broken, and price action is very choppy indeed. It is therefore safe to say that intraday trading is probably too risky to perform at this point. Traders should look towards the daily chart to get some focus for trading.
Outlook for XLM/USD
- Long-term: bearish
- Mid-term: bearish
- Short-term: bullish
EOS/USD
What is the outlook for the EOS token? EOS was equally affected by the overnight sell-off in the cryptocurrency market. After experiencing a gradual increase in price action over the course of 7 weeks, pulling up from the price support of 7 weeks ago at $4.50 to this week’s open at $6.08, EOS has taken a hit and is currently trading at $5.36. EOS is therefore down by 75 cents for the week. A look at the weekly chart below shows that with the new support at the $4.80 area, there is still some room for further downside.
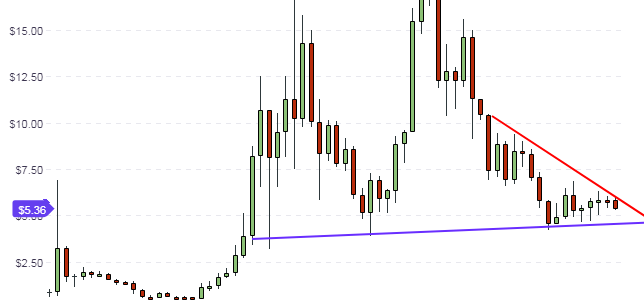
The daily chart shows a clearer picture, with the ascending support line and descending resistance line showcasing the boundaries of price action. The chart shows that despite the drop in prices, the price action has not broken any key price levels. Indeed, what has happened is that the price action has respected the resistance area and the market naturally sold off from that area.
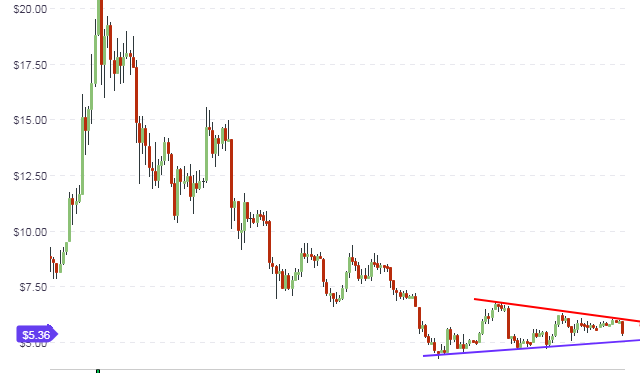
Price action is pushing towards the support line and is it very likely that the price action will indeed attain the support level, as there is still room for such movement to occur. We can also see that the sell-off responded to the resistance level seen on the weekly chart. So for traders of EOS, price action is still functioning within the boundaries of price action.
Going forward, the symmetrical triangle seen on the daily chart will be broken at some point. While there is no clue as to when this will happen, it is pertinent to state that breakouts usually occur at a distance of between 67% and 75% of the distance between the base of the triangle and the apex. So emphasis must be placed on the behavior of the candles at the key area of support. If the support line holds firm, then prices will resume an upward swing back to the resistance area. If the support line is broken decisively, further moves to the south will be on the cards, targeting the next support area below at $4.50.
Outline for EOS/USD
- Long-term: bearish
- Medium-term: neutral
- Short-term: bearish
Disclaimer: information contained herein is provided without considering your personal circumstances, therefore should not be construed as financial advice, investment recommendation or an offer of, or solicitation for, any transactions in cryptocurrencies.


