Bitcoin Cash Posts Minor Gains on News of Its Listing on Gemini: Market Sep. 30
Sep 30, 2018, 3:32pm


Bitcoin Cash is leading the way for the top cryptos with modest price gains on news of its listing on Gemini and Bittrex.
Bitcoin, Ethereum, Bitcoin Cash and other top cryptos made some overnight gains to push them off Friday’s lows. However, crypto prices have not really pushed higher than they began the week. Of all the cryptos analyzed in today’s article, Bitcoin Cash has been the biggest winner, pushing upwards on the news of its listing by crypto exchanges Bittrex and Gemini. As we head into the final quarter of 2018, are we going to see definitive price push to the upside or will it be the same old story that we have seen for much of 2018? Here is an analysis of how the new week is expected to begin for Bitcoin, Ethereum and Bitcoin Cash.
BTC/USD
Overnight, BTC/USD was able to push towards the $6,550 mark, which represents the top end of the range that the asset has traded in throughout the week. BTC/USD continues to struggle to make in-roads to the upside. The expectation has been for the asset to hit the descending trendline resistance at the $7,000 mark. So far, this has not happened.
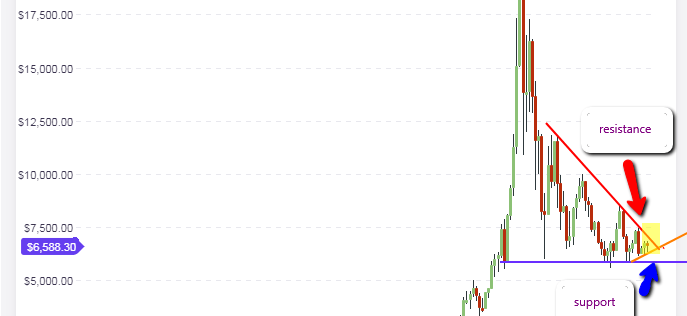
Looking at the weekly chart, we see that the price candle is in the middle of this price move. The weekly candle looks set to close as a pinbar, which is only significant in the context of the support line formed for the last three weeks (orange line within the pattern). Perhaps this opening week of October 2018 may be the week that the bulls have been waiting for to make their move from this line. However, there is very little to work with in this regard and it is better for traders to see how trading goes in the first two days of the week.
The daily chart shows the situation more clearly. We see a symmetrical triangle formation, with prices bound between the ascending support line (in blue) and the descending resistance line above (red line). Price action is right in the middle: it could go south to hit the support line, or it could go north to hit the resistance line. Again, it is important to wait to see what price action will be in the next two days of trading for us to get some direction as to where Bitcoin would go.
The setup on the intraday hourly chart reveals that the price action is presently located between the central pivot above ($6,633) and the S1 pivot below at $6,520. Price action has however found support in between these two lines, at a price level that corresponds to an area where price had initially found resistance. In other words, the orange line which depicts this price area is a previous resistance, which has changed its function to become a support. So it is likely that intraday price action continue to be located between the orange line support and the central pivot resistance. If at any time price action candle breaks below the orange line or breaks above the central pivot, then we can see price moving towards the S1 pivot or the R1 pivot respectively.
Outlook for BTC/USD
- Long term: neutral
- Medium term: neutral
- Short term: neutral
ETH/USD
Ethereum is trading well off the $190 support level, with price action currently located at the $233 price area. With Ethereum now in an upside mode, the price action is expected to piush upwards to the $290 price area, where the asset is expected to find its next long term resistance (orange line). Coincidentally, this is also the area where the descending trendline resistance intersects the horizontal resistance. This area is therefore a key area that will determine whether Ethereum will pick up real bullish momentum or not.
The daily chart continues to show the formation of a bearish flag pattern. However, price action was unable to break below the lower trendline of the flag pattern. Price action is still contained within the flag, whose upper border is expected to interact with the long term resistance at the $290 price area. If this area is violated to the upside, then the flag would be invalidated. If the price action is rejected at this area, then the downside would continue to initiate further tests of the flag’s lower border.
Ethereum is finding support at the $228 price area, which is where the orange horizontal line is located. If this line continues to provide support and is not invalidated, then price is expected to get to the R1 pivot area at $238.15 and possibly beyond.
Traders should continue to look towards the orange line to provide support, and to watch to see if the price action candles will break below this area, or will find support at this area as the day progresses.
Outlook for ETH/USD
- Long term: neutral to bullish
- Medium term: neutral
- Short term: neutral to bullish
BCH/USD
Bitcoin Cash has benefitted from a price push off the support line on the long term chart, on the back of the news that Gemini exchange and Bittrex would be listing Bitcoin Cash for trading. This is expected to increase the trade volumes on Bitcoin Cash, and would therefore improve the current demand for the asset. There has been a rearrangement of the support line on the weekly chart, which has transformed the descending triangle pattern seen in previous weeks, to a falling wedge at the present time. We see three weeks of bullish price action off the support line in the chart below:
However, the price action has to push above the next horizontal resistance at $590 for us to see price action getting to the upper descending trendline border of the wedge pattern. The daily chart shows the picture a bit more clearly. We see the orange horizontal line, which represents the horizontal resistance seen at the $590 price area. This is a hurdle that price action must cross to be able to keep pushing upwards.
The intraday charts reveal that intraday resistance is expected at the black line, which is the central pivot at $552. Price action for the day is expected to be bullish, so we may see further tests of the central pivot as the day progresses. If the upward pressure is great enough, we may even see the central pivot being broken, in which case price action will push towards the R1 pivot above.
It must be mentioned that if Bitcoin finds strength to push to the upside, it will provide a pull to Bitcoin Cash and support its upside movements as well. So watch for the situation on Bitcoin in order to get further direction as to the price moves of Bitcoin Cash.
Outlook for BCH/USD
- Long Term – bullish
- Mid-term – bullish
- Short term – bullish


