Bitcoin’s Free Falling, Takes Down Market. Where Do We Go from Here? ETH, BCH Aug. 9
Aug 09, 2018, 2:59pm
With the markets in bearish mode, what is the outlook for Bitcoin, Ethereum and Bitcoin Cash? This article will give a clearer picture.
What a bad week the cryptocurrencies are having, with Bitcoin leading the fall, dropping by 3%, more than $9 billion, following SEC’s decision to postpone their decision on ETFs.
With the bearish sentiment back in the markets, what does the rest of the week hold for the major cryptocurrencies?
BTC/USD
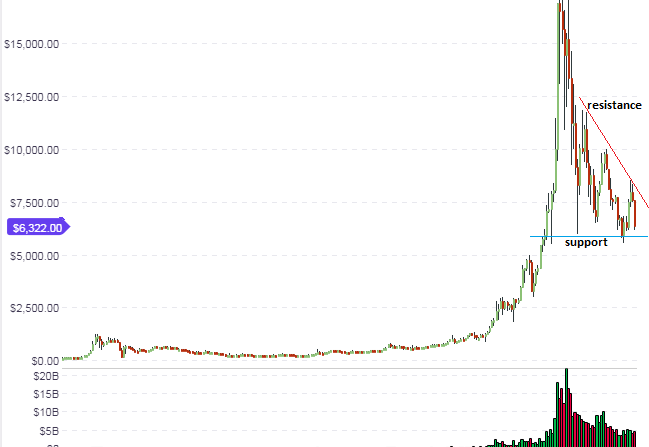
BTC/USD continues to fulfill the long-term expectations on the weekly chart. As identified in the last analysis for this pair, the borders of the symmetrical triangle on the long-term weekly chart remain the boundaries of price action. The price was able to touch the lower end of the range and did not break the support line. We are likely to see further tests of this line on the weekly chart heading into the weekend before a new bar/candle for next week tells us more about the situation.
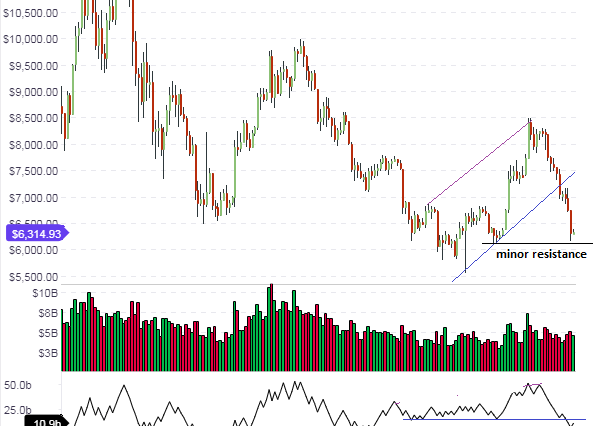
The daily chart shows that the up channel which had been on for a few weeks now has been broken to the downside. However, the price is now at a minor support area ($6,200 – $6,300) and this may serve as a medium-term cushion for prices if that area is tested and holds firm. If the price breaks through this level, expect further downside to the June 2018 lows of $5,700.
The position on the hourly chart is clear. The bias in the market is bearish and we can see prices below the daily pivot.
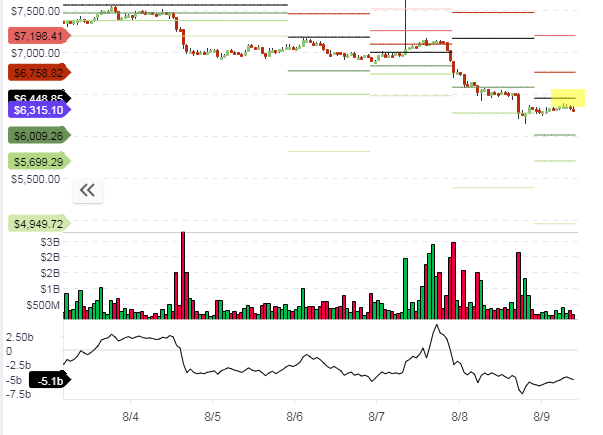
An intraday trade setup would be to sell at the daily pivot within the shaded area, looking to take some quick profits at the S1 level. Intraday trades need to be done with vigilance, as prices on the medium and long-term charts are approaching the minor support area at $6,300.
The outlook for BTC/USD is as follows
- Long-term: bearish
- Medium-term: neutral
- Short term: bearish
ETH/USD
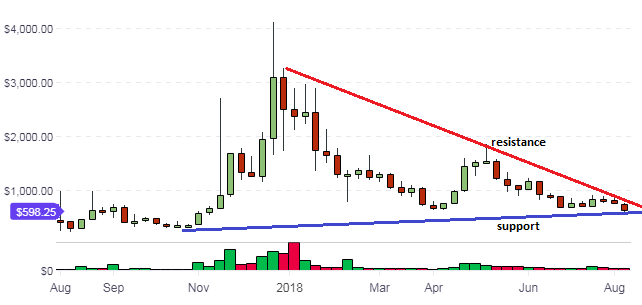
The weekly chart for ETH/USD shows that the price action has achieved a penetration of the support trendline. This is not yet a closing penetration to confirm a downside break, but that there has been a penetration at all is significant. It shows that the current mood in the cryptocurrency market which at the moment, is bearish. Long term, we would need to see the weekly candles close firmly below the support trendline with about a 3% penetration for the downside push towards the April 2018 support of $358.
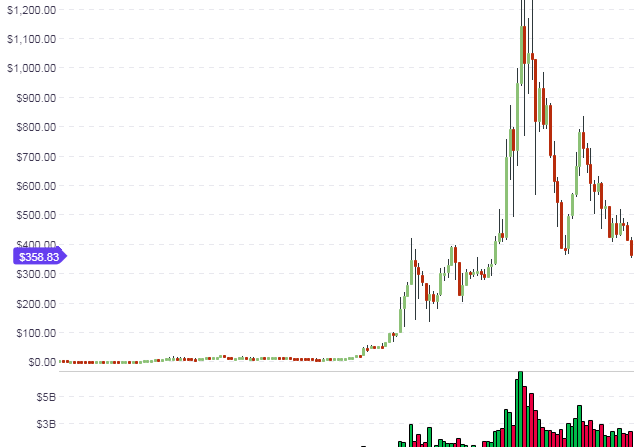
In this chart, the ETH/USD price action is pushing hard on the support line with a long bearish candle. However, this long-term support which dates back to September 2017 has continued to hold firm. How much long this will be the case has to be deduced from the action of this candle and the next two weekly candles on the chart, as price has reached the apex of the triangle and is due for a breakout. The direction of this breakout is unclear at this time. We would need to see a closing penetration of the relevant candles above the resistance or below the support to know where prices will go in the long term.
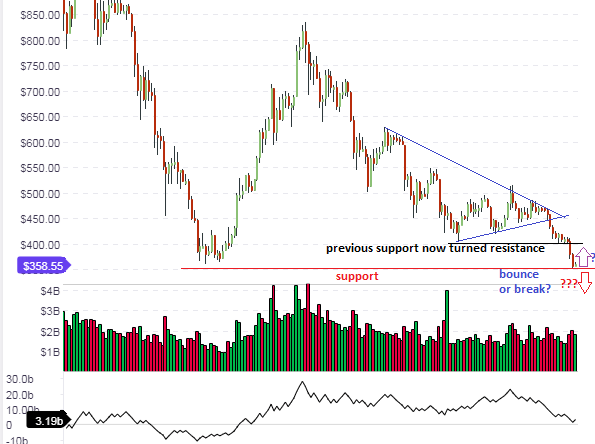
The daily chart above shows that after the trendline break, the minor support of $402 could not hold. This has effectively given way with prices now pushing towards the major support level seen in April 2018 at $358. Two things can happen here. If the price breaks the $358 support level, expect further downside to push towards the $306 horizontal support of September 2017. If the price is able to bounce off this support line, then it should approach the support-turned-resistance point at the $402 mark.
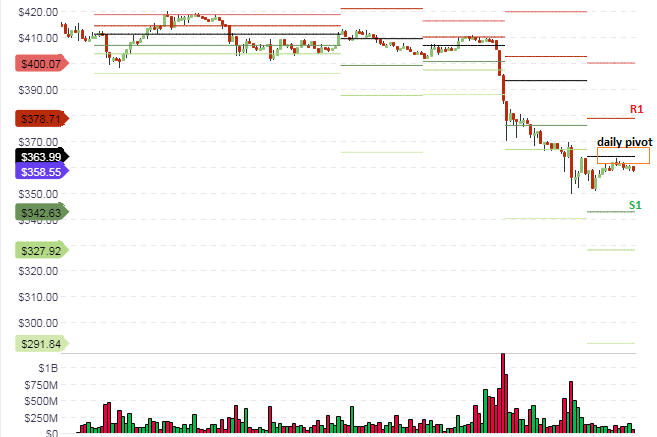
The hourly chart shows the price action being firmly rejected at the daily pivot. The market bias is bearish. Any short trades to follow the mood of the market should be done by allowing the price to pull back up towards the daily pivot. If the candlesticks at that area support a bearish move down (e.g. a pinbar or bearish engulfing pattern which closes below the daily pivot), this would definitely favour further moves south.
The market sentiment for ETH/USD is as following-Term
- Long-term – bearish
- Mid-term – neutral
- Short term – bearish
BCH/USD
Bitcoin Cash is also following its big brother Bitcoin down south. However, the weekly chart shows that the long term support at $598 is holding firmly.
The picture on the medium-term daily chart is one which shows just how far the BCH/USD pair has fallen below the previous support level of . However, we can also see that the previous support level seen on the medium term chart is being threatened seriously. There has already been a break of this line; all we are waiting for is to see what happens to the pullback move which is ongoing. Whether this support level will totally give way or not will depend to a great extent on what happens with Bitcoin prices next week. If Bitcoin is able to stage a little recovery, then Bitcoin Cash will also do the same and this support will hold.
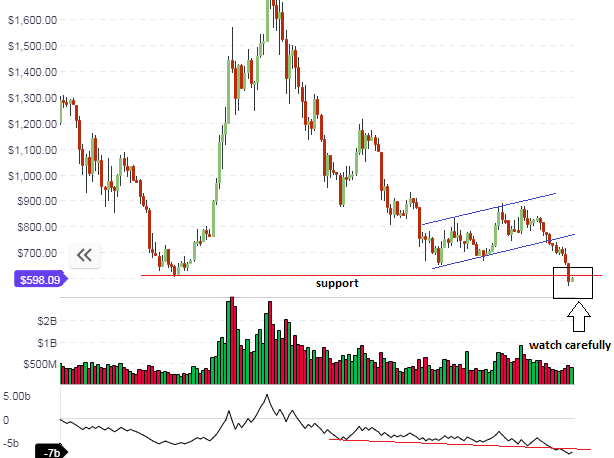
However, if Bitcoin prices continue on their move down south, then the picture at the boxed support area on the daily chart will become significant. There has already been a break of the support line and the pullback move is ongoing. A rejection of this upside pullback at this area will spell further downside for BCH/USD.
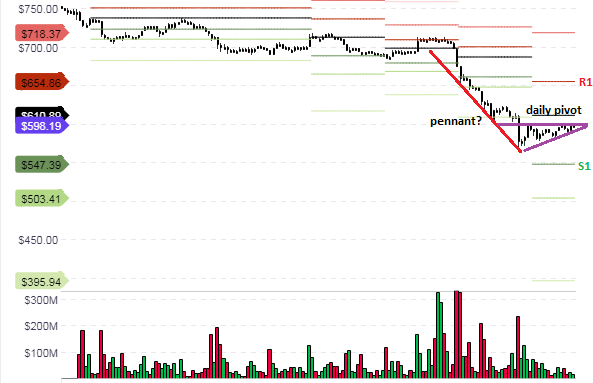
The intraday charts show that the price action may be in the middle of a bearish pennant formation. If this is the case, then we may see prices being rejected at the apex of this pennant (which is at the daily pivot) and a push down south to the S1 pivot is likely. Therefore, day traders should wait out this situation patiently and only take trades when the picture with this potential pattern formation is much clearer.
The outlook for BCH/USD is as follows
- Long-term: neutral
- Medium-term: bearish
- Short-term: bearish


