BTC, ETH, XRP, BCH, LTC, EOS, Technical Analysis: Thursday, 19 July 2018
Jul 19, 2018, 11:47AMAre this week's highs merely upside retracements from the existing downtrend or is optimism really in order? An analysis of the top 6 coins.
This week has been a relatively good one for the major cryptocurrencies, as they all posted short-term gains from last week’s lows. However, viewed from a mid- to long-term standpoint, all we've really had are upside retracements from the existing downtrend. This is in keeping with our analyses from last week, where most of the major cryptocurrencies were still expected to trade within their upper and lower ranges.
So while there is a bit of a renewed optimism, it is “not yet uhuru” for the top 10 cryptocurrencies, many of which still cannot break the major resistance. As we head into weekend trading, what does the market hold for the top 6 cryptocurrencies?
BTC/USD
As indicated in the analysis for Thursday 12 July 2018, the presence of a support trendline on the daily chart and the H4 chart, connecting the two previous lows of the weeks prior to last week was noted. The price of BTC/USD got to this support line and it held firm. Bargain buyers saw this as a good buying opportunity within the context of the range that Bitcoin has been trading in, at between $6,750 and $6,050 for close to three weeks now. There was strong buying which drove prices to the upper limit of the range at $6,750.
The rising support line showed that buyers were ready to push prices beyond the flat upper limit of the range at $6,750, which they successfully did on Tuesday, July 17. Having breached the $6,750, the price got to the resistance area at between $7,280 and $7,400.
What is the expectation for the weekend?
From a medium to long-term perspective, any further upside move for Bitcoin has to breach the $7,500 resistance line by at least a 3% closing penetration. If this is achieved, uncommitted traders who have been watching things from the sidelines will get in on the upside move, driving prices further upwards. The next target over the next few weeks would then be at the $8,500 resistance area if this is the case. Already, the $7,500 mark has been tested twice and it has held firmly to combat any further upside. Expect this area to be tested a few more times heading into the new week.
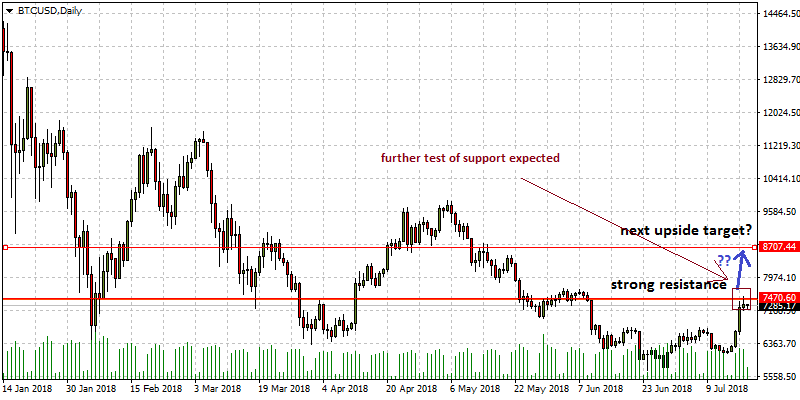
If the resistance at $7,500 is not broken, then the new range for trading will be from this level all the way to the breached resistance of $6,700 and even further down to the rising support line, which would keep prices above $6,400.
On the intraday level, we look to the pivot points for the day. The hourly charts show the price to be confined to a tight range, as the price tests the $7,500 area.
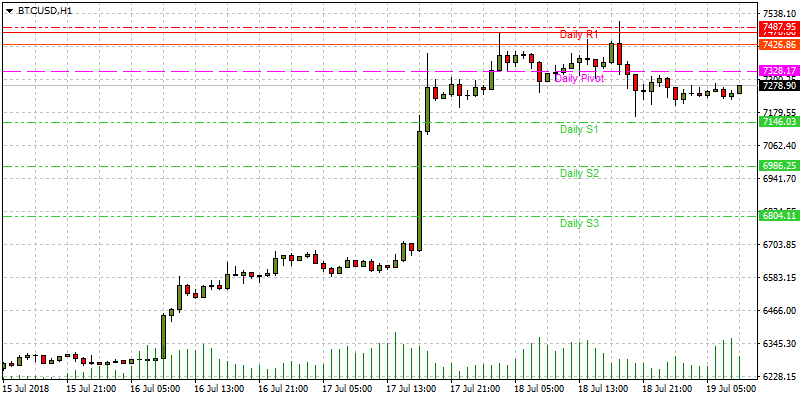
This would keep prices firmly locked within the daily pivot and the S1 pivot. Use closing penetrations of these pivot lines to make any intraday buying or selling decisions.
ETH/USD
The ETH/USD pair was also buoyed by the gains seen on other cryptocurrencies to post some gains. Ethereum is showing great potential for further upside, especially as the daily chart shows that the double bottom has formed with what looks like a break of the neckline. Buying volumes are also going up.
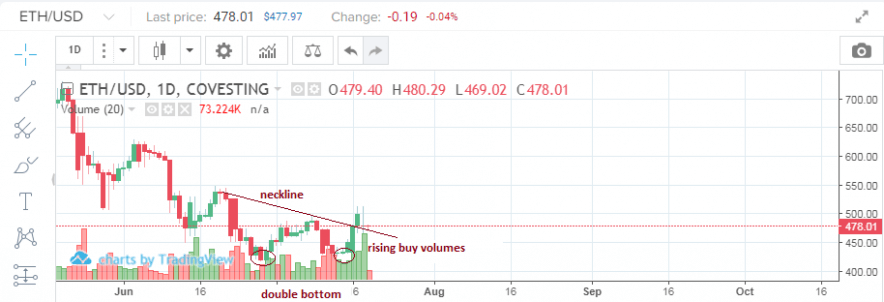
We seem to be in the middle of a return move to the broken neckline. The next few days will show the true situation, which will either confirm the upside reversal from the double bottom or show a failed pattern.
Intraday, the picture is unclear as the price has been stuck within the S1 – central pivot range, with very little movement. It may be best to watch the situation on the daily chart more closely before deciding on any trade moves.
XRP/USD
The long-term focus for Ripple has not changed. Upside is still limited by the horizontal major support at $0.50, with the floor of the price range located at $0.39. Price will continue to trade within this range for some time to come.

Intraday trading will have to rely solely on the pivot points. Presently, price continues to be confined between the S1 pivot support and the daily pivot line. Trading will continue to be range bound, so the strategy really should be to use the ceiling and floor of the identified range (i.e. $0.50 to the upside, and $0.39 to the downside) for setting up trades.
BCH/USD
The descending triangle pattern identified on the daily chart in our last analysis performed according to expectation, but the downside break was limited by the strong long-term support located at the $600 - $610 area.

This area was identified by bargain buyers as a good buy area and spurred on by the week’s gains on Bitcoin, Bitcoin Cash had a brief upside spell to the $900 resistance area, which corresponds to the resistance last seen in mid-June 2018.
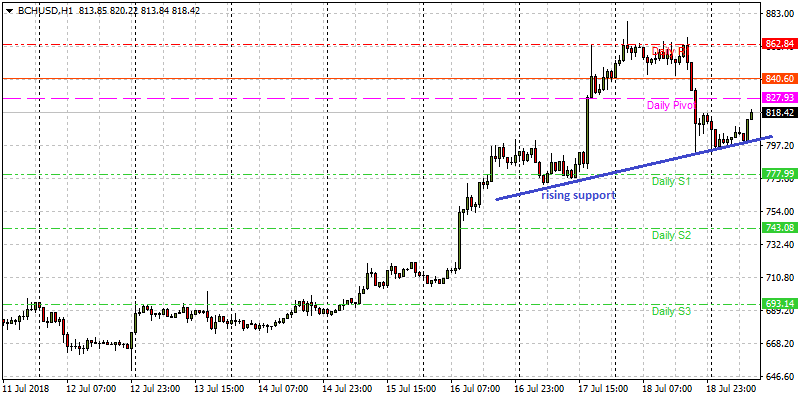
On an intraday basis, price continues to range between the S1 and daily pivot, with a rising support line which has formed a basis for a price bounce. The rising support and the pivot points will serve as the basis for short-term entries, depending on whether these areas are broken or not.
LTC/USD
Litecoin usually mirrors the moves of its big brother Bitcoin. The price of Litecoin hit the $69 mark, which was very close to our projected support of last week at $68. Bargain hunters also identified this as a potential buying area, and buoyed by the Bitcoin buying spree of the last few days, buyers pushed the price of Litecoin up to the next major resistance of $90 - $92 on the long-term daily chart. Having tested this resistance, prices have taken a breather to the $84 mark.
However, the D1 chart throws up an interesting scenario: the formation of a potential double bottom with a neckline at the $88 mark. Buying volumes are also going up.
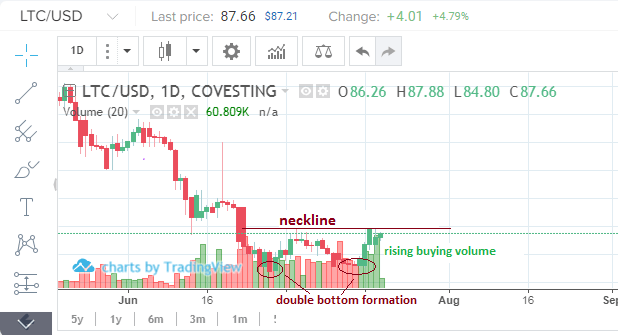
For any further upside to occur, the price must have an upside closing penetration of the neckline as shown on the chart. This may take some time to occur, if indeed it will. It is possible that the neckline resistance will hold firm and prices will fall, perhaps to form a triple bottom or something else. This is a setup definitely worth watching for the medium-term.
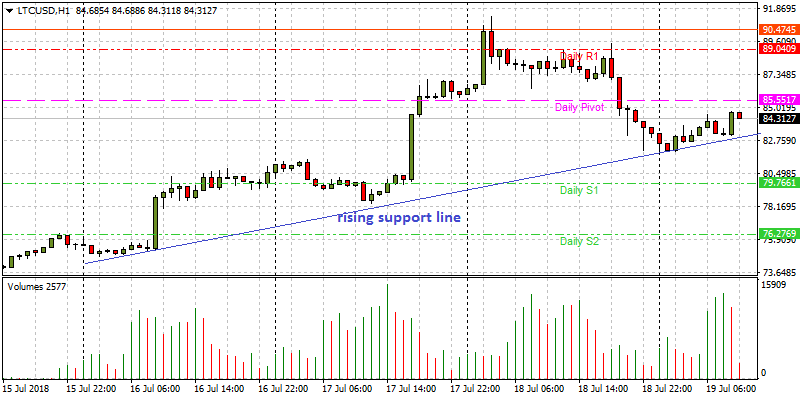
On an intraday basis, the price is presently confined between the S1 support pivot and the central pivot line. Note the presence of the rising support line which may form a basis for an intraday bounce. It is very likely that in the context of the picture on the hourly and daily charts, an upside is very likely. Look for a bounce of price on the blue rising support line, or a bounce on the daily pivot at the very least.
EOS/USD
EOS/USD is still teetering on the weekly support line as shown below. This seemed to have been broken, but we need to see a second candle performing a closing downside penetration of this line to see further downtrend on EOSUSD for the long term.
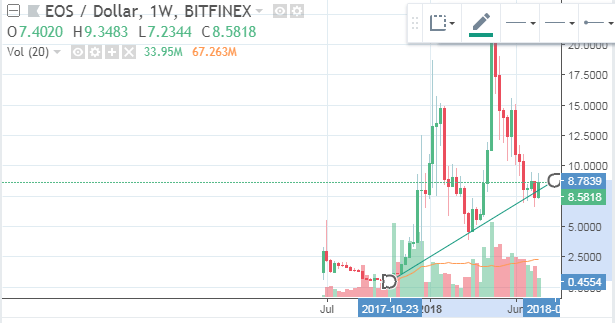
The EOS/USD daily chart shows that price is presently limited to the upside by a descending trendline, which interestingly closed on July 18, 2018, with a pinbar. Buying volume has also thinned considerably.
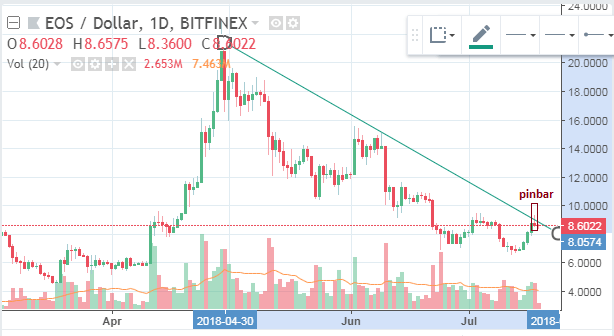
We may be in for another ride south over the next few days. Traders should use the short-term charts such as the hourly charts to time their trade entries.
Disclaimer: information contained herein is provided without considering your personal circumstances, therefore should not be construed as financial advice, investment recommendation or an offer of, or solicitation for, any transactions in cryptocurrencies.


