
BTC Sheds Gains, TRON HODLers Await Tron Virtual Machine Launch: Markets Aug. 30
Aug 30, 2018, 11:35AMTRON HODLers anxiously await the launch of the TRON Virtual Machine, even as the Bitcoin bears have started to rear their heads once again.
The cryptocurrency market shed some of the gains that had been made earlier in the week, with Bitcoin leading the mild retreat. TRON HODLers are also itching to find out if their wait has been worth it. So what does the rest of the week hold for three of the top cryptocurrencies as we wind down on a very eventful August?
BTC/USD
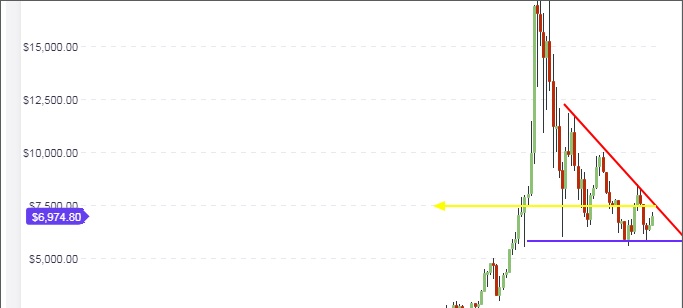
As before, the outlook for long term trading on the weekly BTC/USD chart remains unchanged. The weekly candle looks set to close the week on a higher note, but there are signs that further upside will be tapered by the descending trend line which looks set to touch the price action at just above the $7,000 mark. Bitcoin continues its gradual rally from the long term support of $5,700, and has been unable to cross above $7,100. At the moment, BTC/USD is holding above the previous short term resistance at $6,800. This broken short term resistance is now holding Bitcoin prices above this prive level. The end of the week and the closure of the weekly candle will determine whether BTC/USD still has further upside left or not.
The daily chart shows that price has broken the 50-day moving average, but has turned down and is now being supported by the moving average. This corresponds to the short term resistance seen at $6,800.
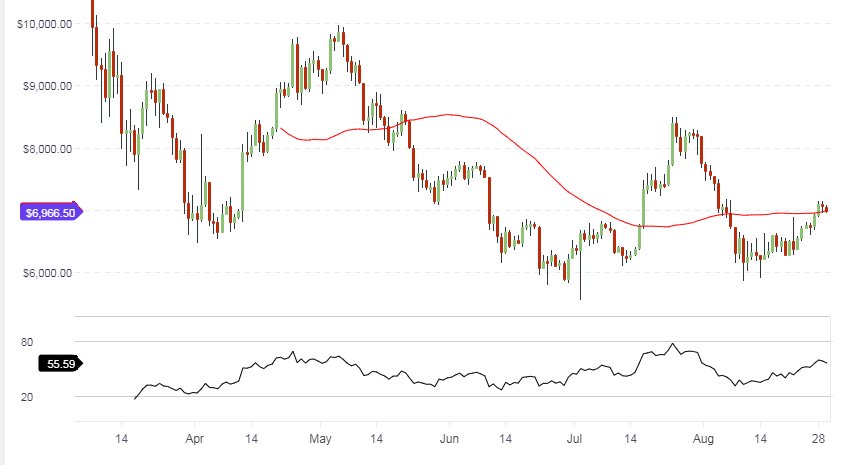
If the daily candle breaks below the 50-day moving average, we may see a retreat from present levels begin to occur. However, a successful support of price at this area will see prices attempting a further push to the descending resistance trend line on the weekly chart at around $7,200. If there is no fundamental change to the outlook, prices of BTC/USD are not expected to go beyond this level.
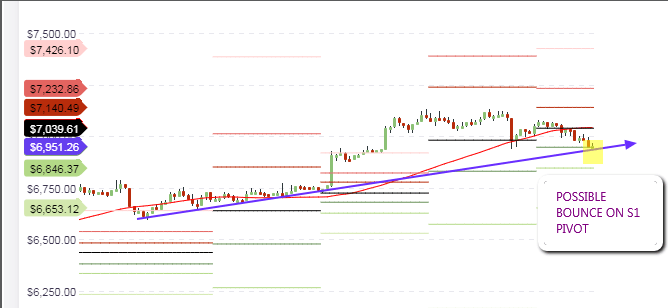
Intraday traders who follow the hourly chart can see that the price action is presently bouncing on the S1 pivot at $6,951. This pivot may prove to be strong enough to support a mild upside at least to the central pivot at $7.039. If this pivot fails to hold up prices, we may see further downside for the day, at least the S2 pivot at $6,846.
Outlook for BTC/USD
- Long-term: bearish
- Medium-term: neutral
- Short-term: neutral or mildly bullish
TRX/USD
TRON, which is listed as TRX/USD, is awaiting some big news on August 31. That is the day that the much-hyped TRON Virtual Machine will be launched. Whether this news will prompt the TRX HODLers to buy more of the asset or start to dump it remains to be seen. However, the medium term charts reveal that price action has hit the upper trendline as predicted in our last analysis piece. Having hit this resistance, prices have started to turn down.
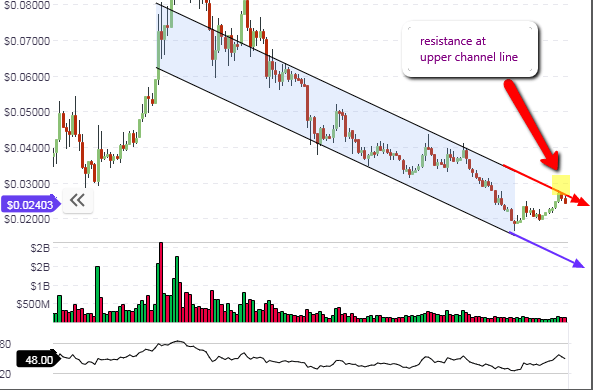
A lot will depend on the reaction of HODLers of TRON. If the investors fail to be impressed by the TVM launch, we may see a sell-off which will push down prices at least to the lower channel line, which presently offers some support. The channel is downtrending, which means that the bias of the market is still bearish. There needs to be a strong bullish reaction from TRON investors to tomorrow’s news to prompt an upside move that will break the upper channel line and produce a true upside reversal.
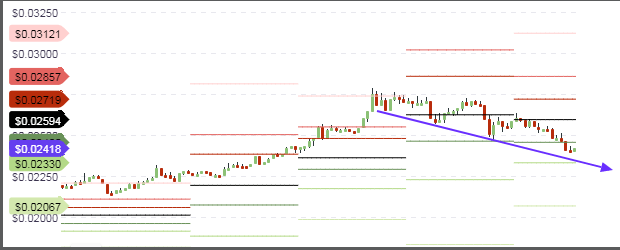
Intraday, we see that the price action is turning downwards and aiming to find some support, probably at the S2 support. However, the price still has some downward momentum left before this support area is tested. Traders are therefore best served by selling on any rallies to the S1 pivot, if the candlestick does not close above this level. Better still, it may be wise to wait until after tomorrow’s launch before making any trade decisions.
Outlook for TRX/USD
- Long-term: bearish
- Medium-term: neutral to bearish
- Short-term: neutral
XLM/USD
Stellar Lumens is showing some good tradable setups on the daily and intraday charts. The daily chart shows price action contained within a symmetrical triangle, with price action heading down to the lower border of this triangle. This is coming on the back of price rejection at the upper border of the triangle, which coincided with a horizontal resistance line.
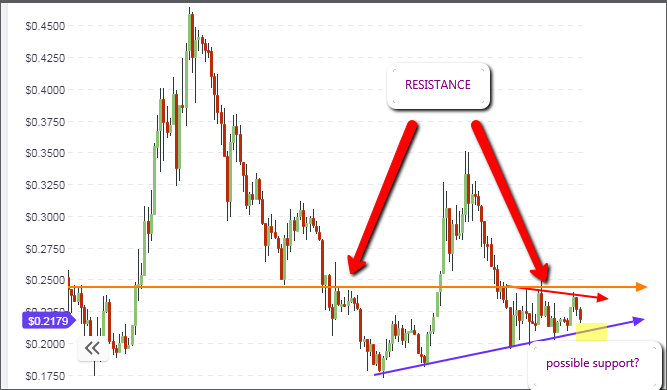
We may see prices trading within the triangle until we approach the point of convergence at the apex where price is expected to break out in one of the two possible breakout directions.
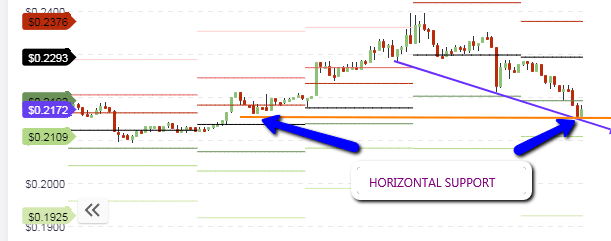
The intraday chart reveals that the price action has found support at the same area where a horizontal support has been found. This is at just below the $0.25 mark. We may see a short bounce to the S1 pivot ($0.2171) from present price levels at the S2 pivot ($0.2109), before a renewed round of selling ensues in an attempt to force prices to the lower triangle border. Therefore, selling on rallies to a pivot point may be the way to go so as to align with the picture on the medium-term chart.
Outlook for XLM/USD
- Long-term: bearish
- Mid-term: neutral
- Short-term: bearish
Disclaimer: information contained herein is provided without considering your personal circumstances, therefore should not be construed as financial advice, investment recommendation or an offer of, or solicitation for, any transactions in cryptocurrencies.


