Bulls See Opportunity, Forcing Prices Up, BTC, ETH, BCH Market Analysis: Aug 16, 2018
Aug 16, 2018, 2:21pm
Brief rallies in price for BTC, ETH and BCH represent trasient buying opportunities. Understand how to trade these cryptos using key levels.
The top cryptocurrencies have been able to make some brief recovery after selling pressures waned in the last two days. We are likely to see slight upside moves heading into the weekend. The brief rally was really not a surprise, as cryptocurrencies like Bitcoin and Ethereum were already heavily oversold and were pushing against support levels that have remained strong. Bulls therefore saw some buying opportunity, and have been able to force prices upwards.
So what is the outlook for the top 3 cryptocurrencies heading into the 3rd weekend of August?
BTC/USD
As expected, the BTC/USD was unable to break the long-standing support level seen at $5,700 – $5,800. The weekly chart reveals that price action continues to remain within the confines of the horizontal support and the descending trendline resistance. Right now, the price is on its way back up to this resistance, after bouncing off the support level. However, the overall sentiment is that the price of BTC/USD will find it difficult to break the resistance line without some strong positive news going forward.
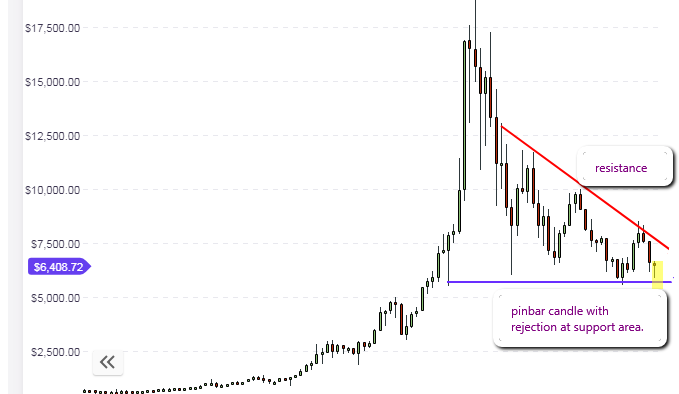
The weekly candle has transformed into a pinbar, which is significant. Not only does this mean that prices are unlikely to break the support level this week, it also means that the upside rally is expected to continue at the beginning of next week. However, the close of the candle this weekend will indicate if this is the case or not.
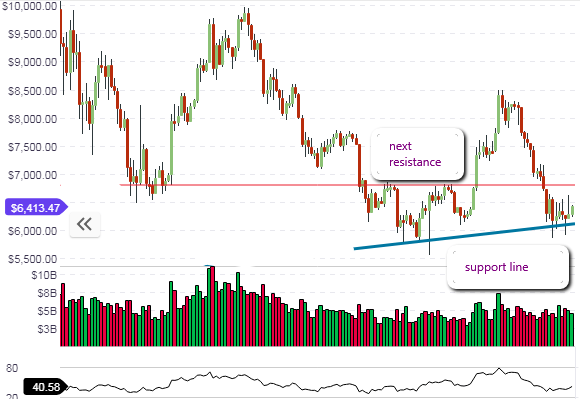
The picture on the daily chart continues to support the present rally, as price action has taken a bounce off the support line (blue). The next target is expected to be the resistance line at $6,700. This region represents a key level which has been broken bi-directionally in the last three months. So it is only expected that price action will at least, test this area in the coming week.

The hourly chart reveals that price action has found a short-term support at the central pivot, with a good possibility of further upside movement. This gives the BTC/USD a bullish momentum for the day.
– Outlook for BTC/USD
- Long-term: bearish
- Medium-term: Weakly bullish
- Short-term: weakly bullish
ETH/USD
Ethereum is recovering from the lows it attained earlier this week. However, the major support seen at $380-$390, which was broken last week remains broken. This will now serve as the next target for any rallies from the present support at $280-$290, which is looking like it will hold firm.
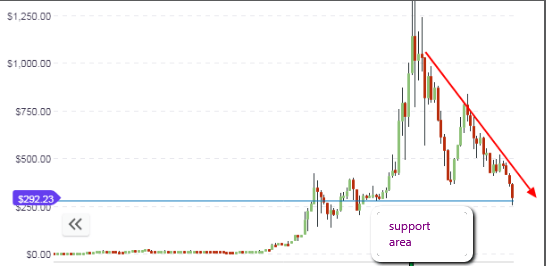
The price action on the daily chart is still contained within the downward channel that was identified in our last analysis. We are already seeing a bounce off the lower channel line. A divergence setup is also emerging as the oscillator is displaying higher lows.
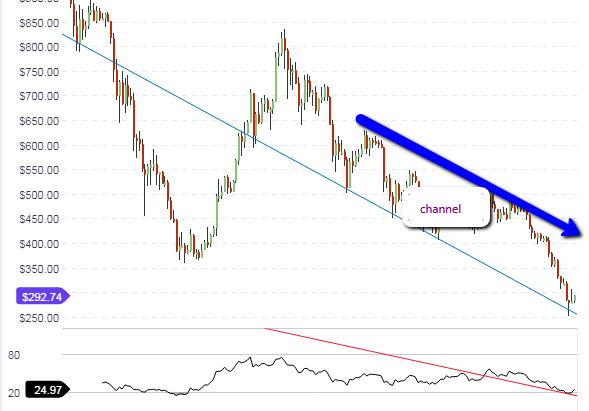
Therefore, it is expected that the price action will rally from this point to at least the upper channel line, which is also at the same area where the previous horizontal support at $390 is expected to act as a resistance.
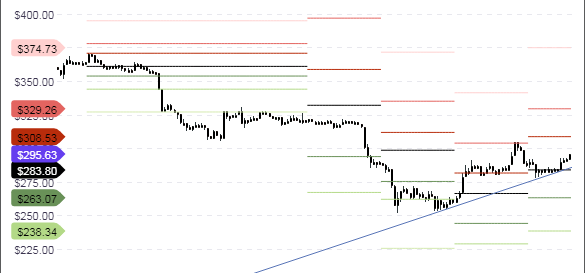
The hourly chart shows price in a rally movement from the central pivot. Any rallies will be short-lived as price action will have to break above the resistance level of $390 that is hanging above it.
The market sentiment for ETH/USD is still bearish. Many ICO investors are still liquidating some of their holdings and converting the Ethereum derived from such sales to fiat currency. Therefore, the logical trades on ETH/USD will be to sell on the rallies.
– Market Sentiment:
- Long-term – bearish
- Mid-term – bearish
- Short term – weakly bullish
BCH/USD
The long-term support that was identified on the weekly chart for Bitcoin Cash has been violated, but has not yet been broken. So we really need to wait for the weekly bar/candle to close over the weekend to know if the support level (blue horizontal line) will hold firm or not.

One the hourly chart, Bitcoin Cash is enjoying some bullish momentum, buoyed by the rally in Bitcoin prices seen in the last two days. We need to see if the R1 pivot will hold. If it is broken by intraday price action, then expect prices to at least get to the previous resistance level of $573.
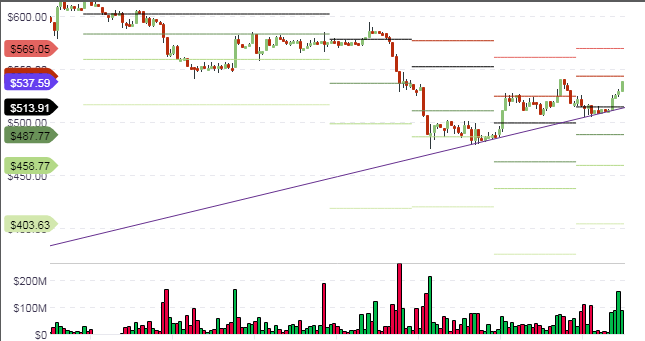
This resistance level will likely undergo some more testing by price action. So any traders should follow the actions of the candles/bars at the pivot points, and look for short-term buying opportunities where price has found support.
Market sentiment:
- Long-term: neutral
- Medium-term: mildly bullish
- Short-term: bullish


