Cardano and Stellar Looking Good for Modest Price Gains, Market Analysis Oct. 9
Oct 09, 2018, 2:05pm
Stellar Lumens and Cardano Look Good to Post Modest Gains, Even as Bitcoin Continues to Struggle Beyond the $6,650 Mark.
Aside from a weak upside move by Bitcoin on Tuesday evening, there has been very limited movement in most of the major cryptocurrencies. However, these periods of consolidation often precede major breakouts. Is the market ripe for some major price moves? Let us see what the charts tell us this today.
BTC/USD
BTC experienced a brief bullish push, but this only resulted in a marginal increase above last week’s highs. This morning, price has started to turn downwards, which is in keeping with the long term analysis for the pair that sees prices continuing to trade within the identified ranges of $5,800 as the floor, and $6,800 to $7,000 as the ceiling.
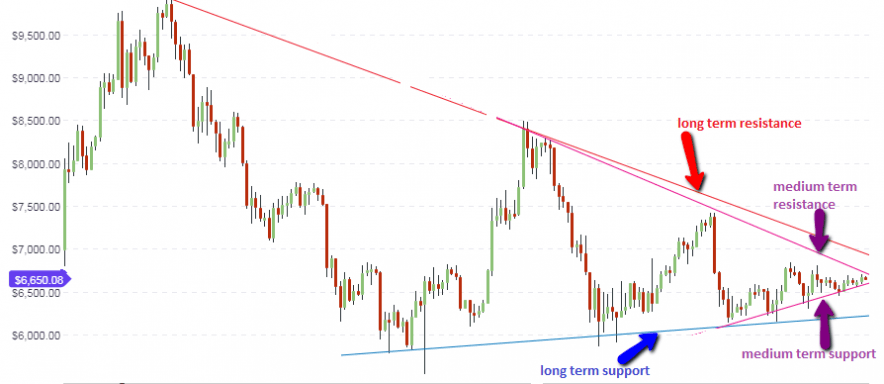
The daily chart continues to be the main focus for trade decisions as far as medium term price analysis is concerned. The daily chart shows the larger symmetrical triangle which captures the long-term support and resistance and the smaller symmetrical triangle which captures the price action in the medium term. We are gradually approaching the apex of this triangle, which means that price is actually due for a breakout. With very weak bullish sentiment in the market, the odds favour a downside push. But until the candles close above or below the relevant trendlines, the price action will continue to trade within the boundaries of the symmetrical triangle.
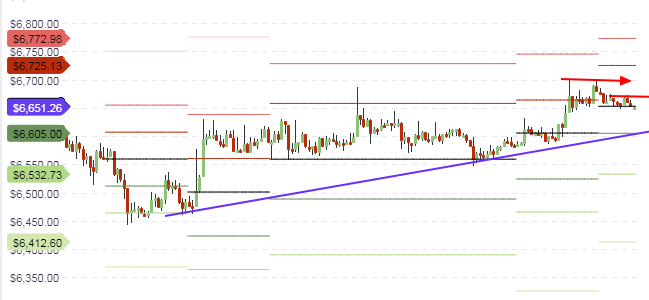
Price action on the intraday charts continues to remain locked in a very tight range. Price action is bouncing on the central pivot, with price action starting to exert pressure on this point. Therefore, we will be looking for a break of the central pivot to the downside, which would then open the door for the downward push to the S1 price of $6,600. The central pivot and the S1 pivot will remain the relevant areas for today’s price movements.
Outlook for BTC/USD
- Long-term: neutral to bearish
- Medium-term: bearish
- Short-term: neutral
ADA/USD
The XRP/USD pair is one of those crypto pairs that have performed above board in the last two months, even while Bitcoin and Ethereum were struggling badly. There seems to be hope for traders who are bullish on ADA, as we see a saucer pattern in evolution on the daily chart.
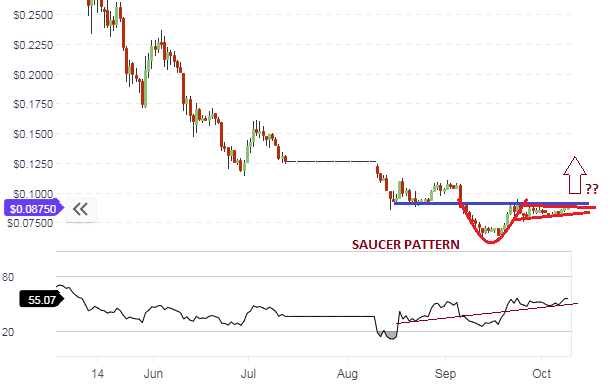
The RSI indicator line is also on the upward trend. Price action is at present within the handle of the saucer pattern. The expected end product of this pattern is for price to break out to the upside from the handle. Barring any unforeseen market events, this seems to be the play to watch for in terms of medium term price movement.
Intraday traders should look to the hourly chart below for direction. We see that the $0.086 price area, which is where today’s central pivot is located, is providing price support for the day. This price area has been tested three times today already and may be the springboard for a short term push to the upside, with the $0.089 price area (R1 pivot) being the next upside target.
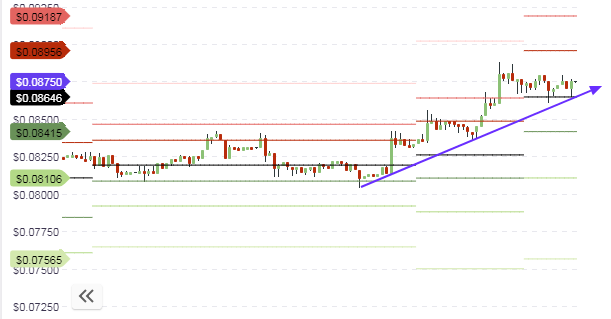
Supporting the view for intraday upside movement is the fact that an ascending trendline that connects the lows of the last three days. This is a reinforcement of the support, as this line intersects the central pivot line (see chart). Therefore, intraday traders can take some short bounce trades off the central pivot.
Outlook for ADA/USD
- Long-term: neutral
- Mid-term: bearish
- Short-term: bullish
XLM/USD
What is the outlook for Stellar Lumens? Just like many of the top cryptocurrencies, Stellar Lumen’s price action of 2018 has allowed the identification of clear-cut support and resistance areas on the long-term weekly charts. Long-term support is found at 18 cents, and long-term resistance is expected to approach price candles at the 28 cents price level.
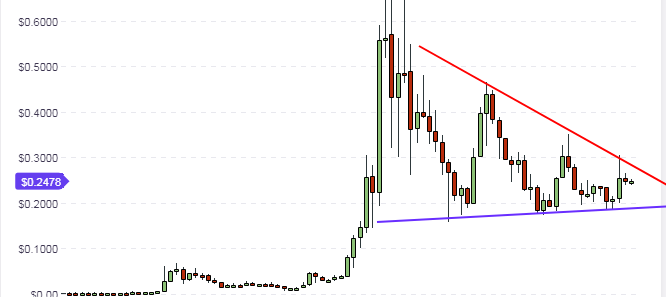
The daily chart shows a horizontal key level at the 23 cents price area, which corresponds to an area which first acted as a resistance in the first few months of 2018, and has now reversed roles to provide support for price action. This line is also intersected by a rising support line which connects the lowest points of the price candles in the last 3-4months. This demarcates the area of intersection as the area price is likely to find support in the medium term. This is therefore an area to watch. At the moment, there is room for price to move down to this area to at least test this support level.
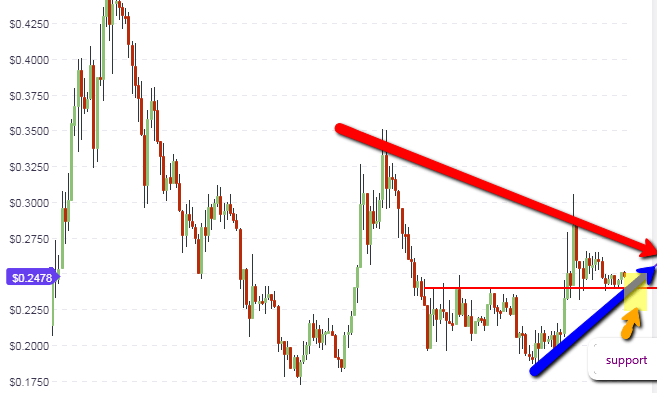
The intraday price chart shows an ascending support line which intersects the central pivot at the 23 cents price area. What needs to be seen is whether the price action will be able to firmly bounce off this area and start to push towards the R1 pivot at 25 cents, or whether the support line (and by extension the central pivot) will be broken to the downside, paving the way for a move to the S1 support line at 24.5 cents.

The closeness in price between pivot points shows that the intraday trading ranges are very tight and should be traded with extreme caution. Intraday traders need to pay attention to the behavior of the candles/bars action around the central pivot point.
Outlook for XLM/USD
- Long-term: neutral
- Medium-term: neutral
- Short-term: bullish


