In the Absence of Positive News BTC, ETH & LTC Continue Their Downslide: Aug. 5
Aug 05, 2018, 3:04pm
The top 4 cryptocurrencies are at key support and resistance levels. Here is the trade analysis for Bitcoin, Ethereum and Litecoin.
The prices of the top cryptocurrencies continued their downslide this week in the light of the absence of any positive news of note for the week. They are now seen retracing to key levels of support. Therefore, the focus for the new week must shift to how the top cryptocurrencies will respond at the key levels that will be identified.
So what is the focus of trades for the new week of trading in August 2018?
BTC/USD
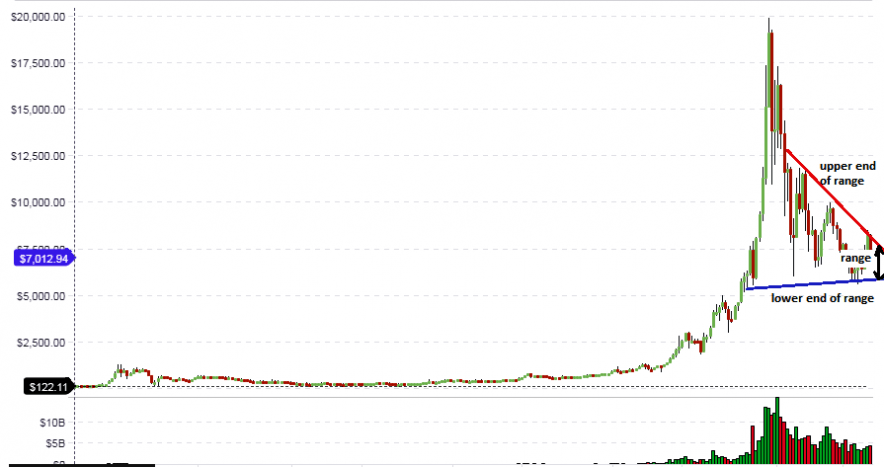
BTC/USD continues to fulfill the long-term expectations on the weekly chart. As identified in the last analysis for this pair, the long-term weekly chart showed a symmetrical triangle pattern whose borders will constitute the trading range for this pair. The price is presently on a downward move from the upper trend line and is heading towards the lower end of the range at the lower trendline. This range trade setup is expected to continue in the long term, pending any major news for the BTC/USD pair.
Medium term, Bitcoin was seen in a bullish pennant and our price prediction in the analysis piece for July 31 was that a brief upside push was possible, but that this was not expected to be sustained. The medium-term chart shows clearly that this was the case. Price broke above the bullish pennant but could not break the $8500 mark to the upside. This was the site of a prior resistance and this was able to hold firmly.
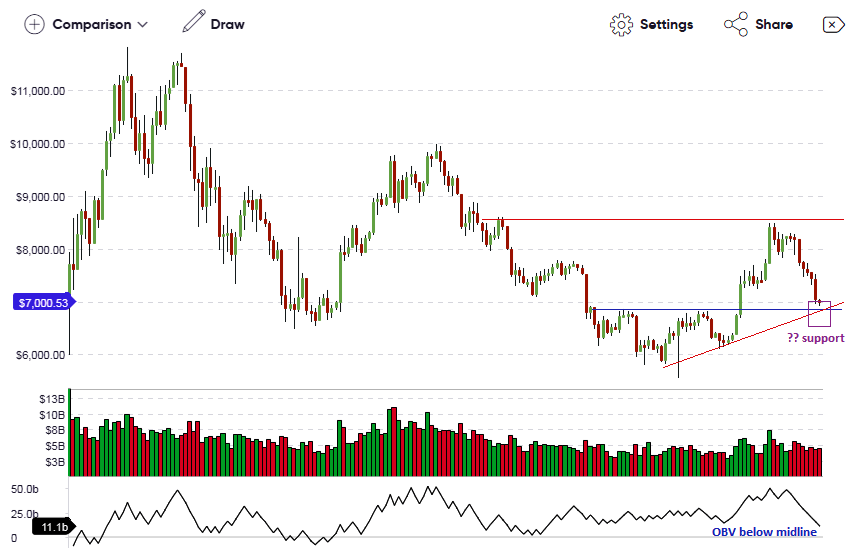
The On Balance Volume indicator is turning downwards, and the volume bars are showing reddish bars, which indicate great selling pressure in the market at the moment. However, the OBV is now in oversold territory.
In addition, the price is pushing towards the site of a previous resistance that was broken at the $6800 mark. This area is expected to now function as a support if it is able to hold back the downward slide of BTC/USD. There is also a rising trend line support (red upward slanting line) from the lows of June and July 2018, which move upwards to intersect the identified previously broken resistance that is expected to function as support (blue horizontal line). Therefore, the medium-term outlook is for price to find support at the $6700 to $6800 price level.
The medium-term outlook now shows the way as to what the intraday traders should do for today. Price has broken through all the support pivots but seems to have found support courtesy of a brief upside reversal saucer pattern.
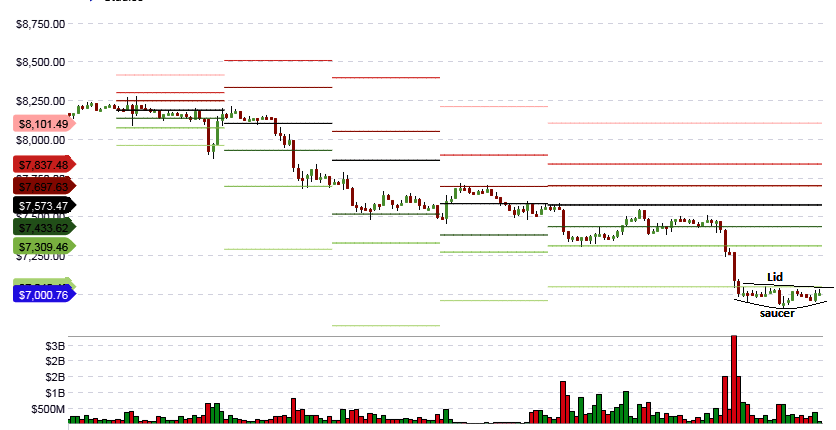
This may well provide some impetus to go long, but day traders have to look at the daily chart to see if the identified support area will hold. If it does, then the saucer pattern breakout through the lid of the saucer will provide a brief opportunity to profit from a brief upside rally.
ETH/USD
The long-term chart (weekly) for ETH/USD shows price still pushing against the lower trend line support for the symmetrical triangle spotted in our earlier analyses for this pair. The price action has not broken this line, nor has it broken through any of the boundaries in any form of test penetration. Therefore, we still need to wait and see where price will be heading to in the long term.
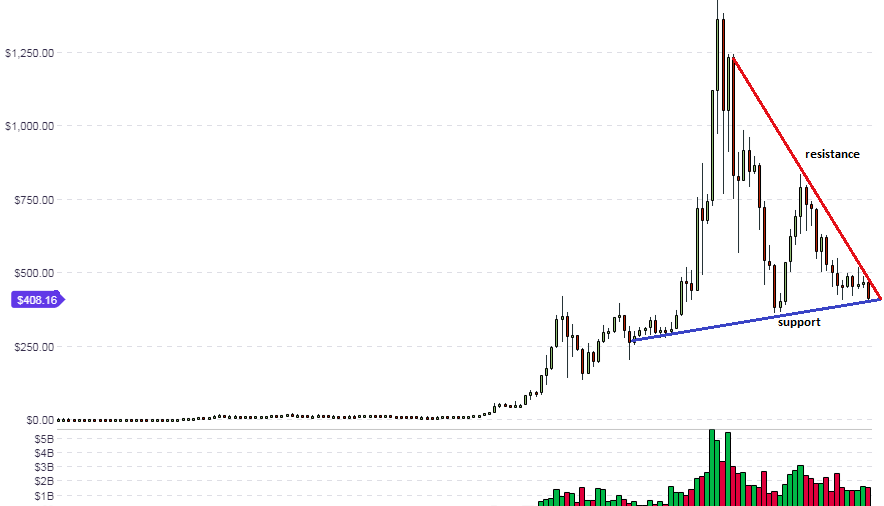
Shifting focus down to the medium term charts (daily), we see that the upside channel which we identified last week has finally broken through the lower channel trendline. However, the price action is very close to the support area that was last seen in April 2014.
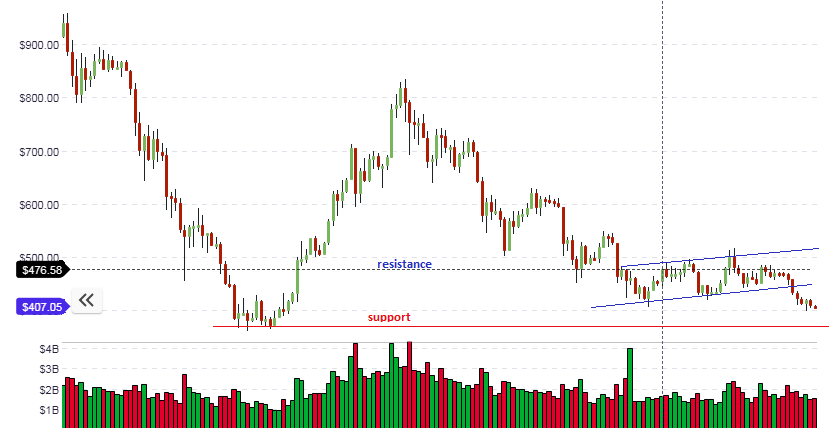
Traders with a medium-term view must therefore wait to see how well this support area will hold. If there is support at that level (close to $400), then we will see the intraday trade setup play along those lines. A look at the intraday charts will show that ETH/USD is presently contained within a saucer formation at the level of the S2 support.
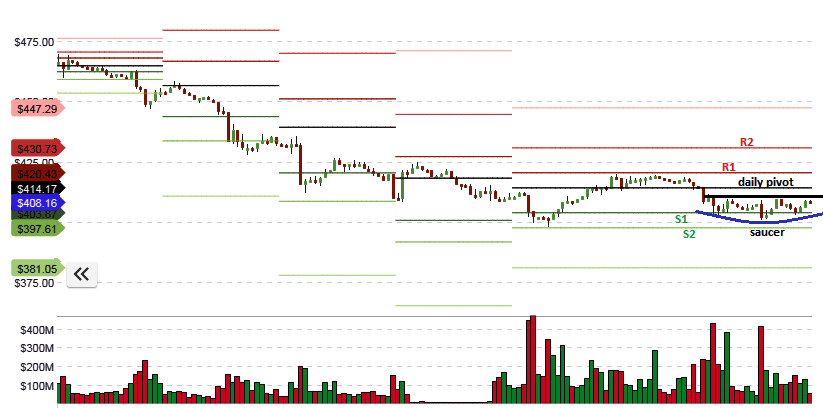
Price may be contained within this saucer until the picture on the daily chart is resolved. Day traders are therefore advised to only trade an upside break of the lid of the saucer if the price bounces at the April 2018 support area on the daily chart.
LTC/USD
The long-term outlook for the LTC/USD is neutral as the price is presently contained within a symmetrical triangle. There has to be a break of either one of the boundaries of the triangle in order for a definite direction to be determined for the pair.
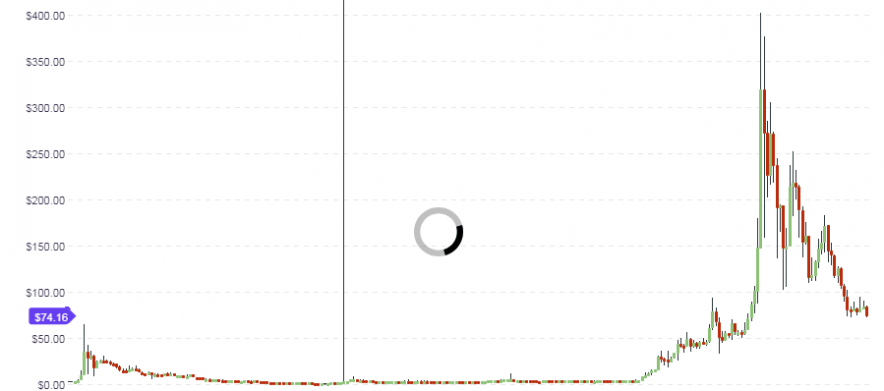
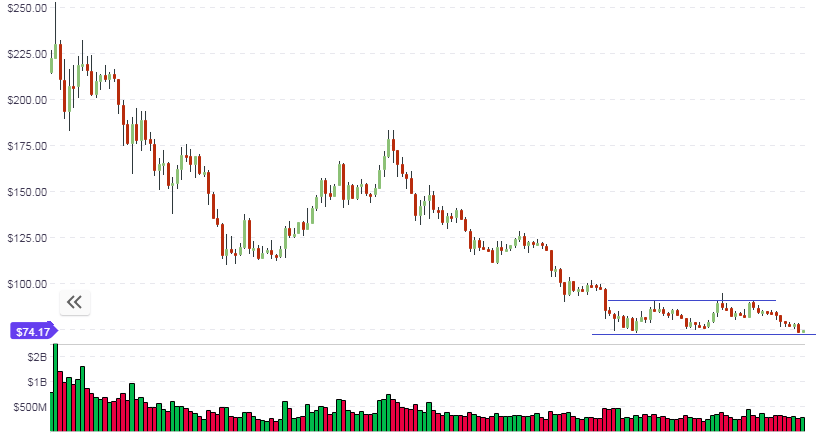
The daily chart showcases the medium-term outlook for the LTC/USD pair. We can see that the price is presently trading in a range which extends from $75.50 to $89.50. The pair is expected to trade within this range if there is no major fundamental shift in the outlook for Litecoin.
The intraday outlook for Litecoin is mildly bullish. The pair has bounced off the S2 support line and is heading towards the upper end of the upside channel seen on the hourly chart.
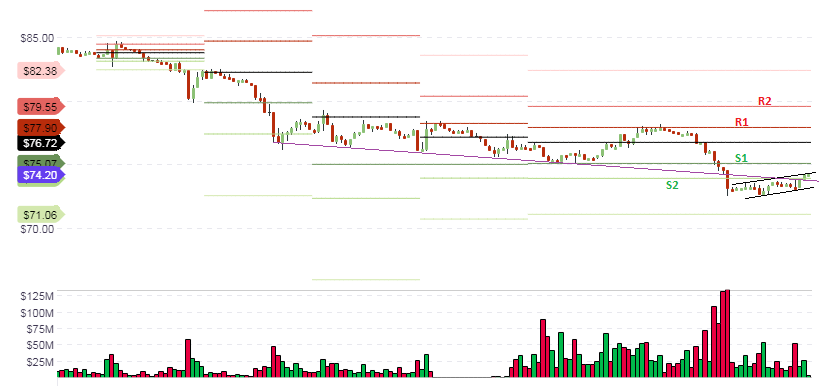
It is expected that price will bounce around this channel as it gradually inches its way up to the upper end of the range identified on the daily chart.


