ETC Is Reemerging Following Robinhood & Coinbase Listing, BTC ETH Analysis: Aug. 7
Aug 07, 2018, 9:02am
One of the best performers of the week has been Ethereum Classic, which is benefitting from some positive news regarding its exchange listings.
The major news for the week comes from South Korea. Bithumb, one of the “big 4” cryptocurrency exchanges, has resumed deposits and withdrawals in 10 cryptocurrencies which were placed on suspension as far as deposits and withdrawals were concerned. Bithumb had earlier suspended deposits and withdrawals in BTC, ETH, XRP, ETC, QTUM, LTC, BCH, XMR, ZEC and MITH, after the exchange lost $30m in a hack attack in June 2018.
In other news, the ETH fork known as Ethereum Classic is experiencing a resurgence, buoyed by the recent announcement of the listing of this coin by both Coinbase exchange as well as the Robinhood crypto trading app.

We are seeing a generous amount of buying volume on the ETC/USD pair, and so it has been decided to feature this pair in today’s analysis.
BTC/USD
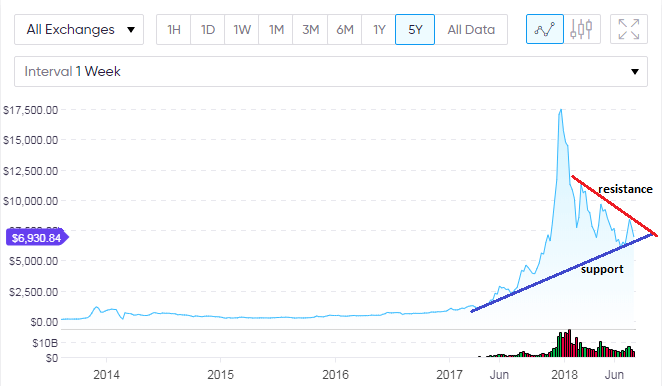
BTC/USD continues to fulfill the long-term expectations on the weekly chart. As identified in the last analysis for this pair, the borders of the symmetrical triangle on the long term weekly chart remain the boundaries of price action. Price is still pushing towards the lower trendline, but is not there yet. There is therefore still room for price to head further south.
The hourly chart shows the outlook for intraday trades. The price is firmly being resisted at the daily pivot, where there also happens to be a convergence point of the sloping resistance line.
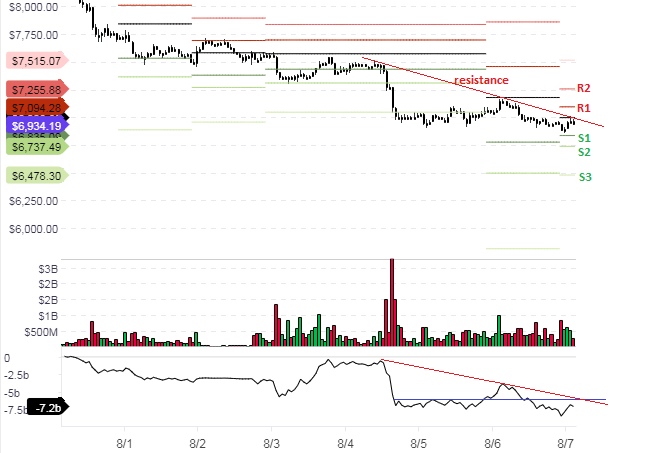
Therefore, it appears logical to take short positions at the central pivot or if the price has already shifted downwards, to sell on rallies to either the pivot or the sloping trendline.
Market Sentiment:
- Long Term – Bearish
- Mid-term – Neutral
- Short term – Bearish
ETC/USD
The listing of Ethereum Classic on Coinbase and the Robinhood app is doing wonders for this pair, which has suddenly seen a bullish resurgence this week. So what is the outlook?
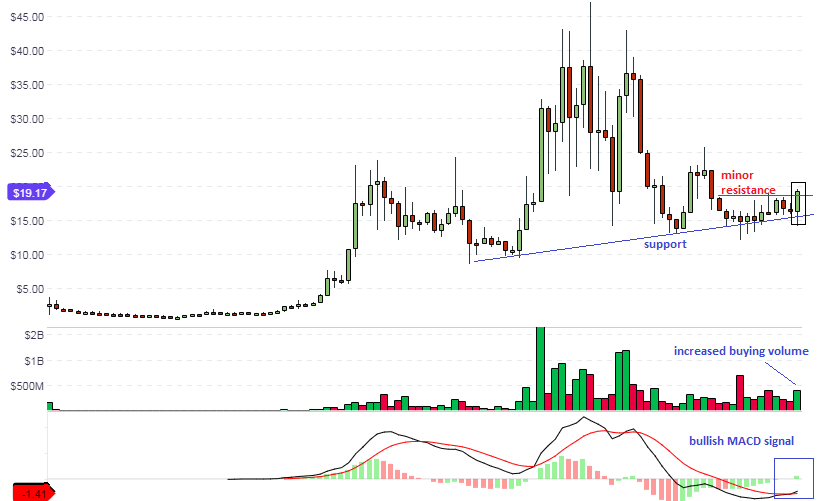
The long term chart shows that ETC/USD has found a firm upward trendline support, from which the weekly candle has taken off in its upward swing. This candle has also breached the minor resistance line formed in the last 11 weeks, though it has not closed above this level yet. Bullish support is also seen in the MACD indicator as well as the increased buy volumes.
The medium term chart shows a much clearer picture. The resistance formed by the upper sloping trendline has been broken, providing an impetus for further upside in the medium term.
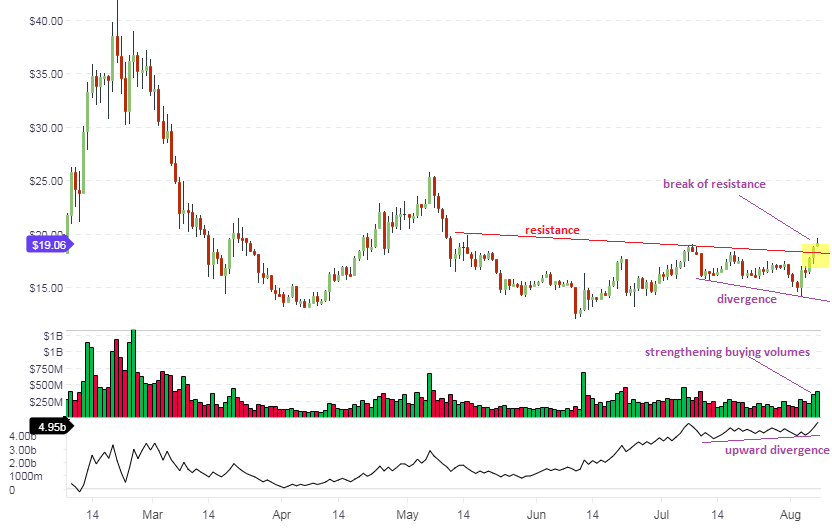
There is also a clear positive divergence, which is now playing out as a divergence correction to the upside by the price action. This is also supported by an increase in buying volumes. This provides a bullish outlook for ETC/USD in the medium term.
So what should the day traders be doing? We can see that the price action has taken a huge jump from the daily pivot mark and is presently approaching the R2 pivot.
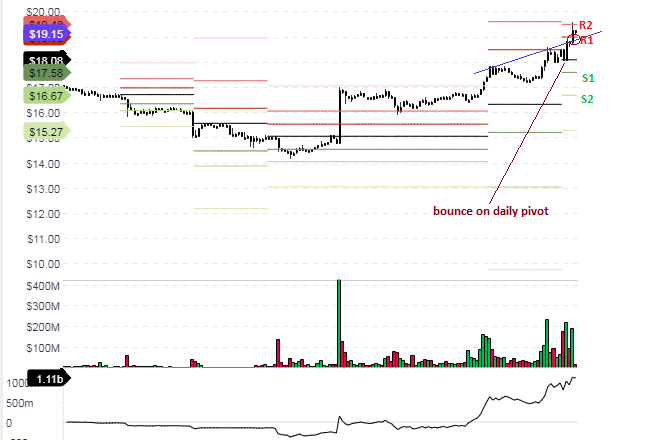
The blue resistance line was taken out by this move. This line intersects the R1 pivot. Therefore, day trades should buy on a dip to the R1 pivot, with R2 set as the first profit target.
Market Sentiment:
- Long Term – Bullish
- Mid-term – Bullish
- Short term – Bullish
ETH/USD
The weekly chart for ETH/USD shows the presence of a triangle pattern, as has been the case with most of the top cryptocurrencies.
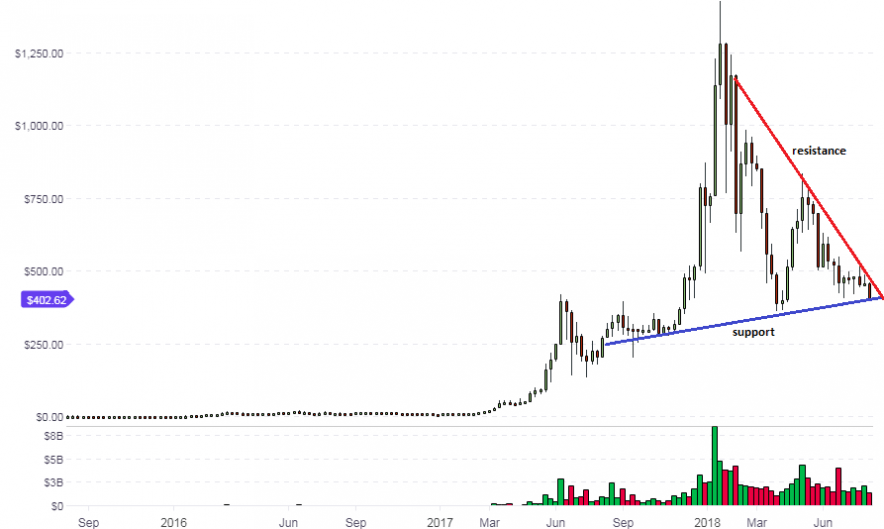
In this chart, the ETH/USD price action is pushing hard on the support line with a long bearish candle. However, this long term support which dates back to September 2017 has continued to hold firm. How much longer this will be the case has to be deduced from the action of this candle and the next two weekly candles on the chart, as price has reached the apex of the triangle and is due for a breakout. The direction of this breakout is unclear at this time. We would need to see a closing penetration of the relevant candles above the resistance or below the support to know where prices will go in the long term.
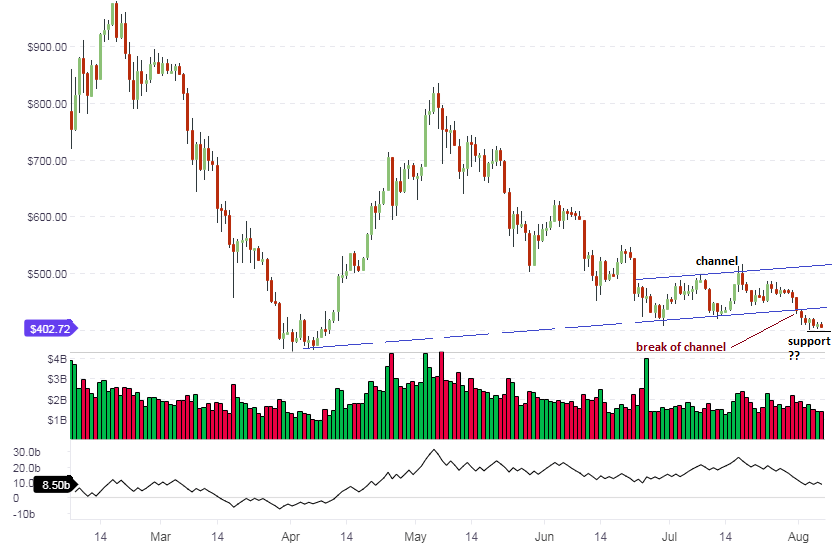
The daily chart shows that the downside move of the price action following the lower channel line break has temporarily stalled and is searching for direction. This is in conformity with the view on the weekly chart, which shows the price action being held up at the lower trendline support line.
The hourly chart shows the price action bouncing off the S1 support pivot and pushing against the central pivot line, on the back of increased buying volumes.
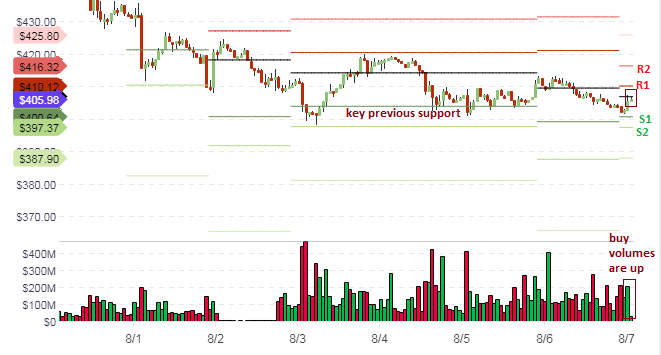
Intraday traders should look for a possible upward break of the central pivot. This would serve as a springboard for short term long orders.
Market Sentiment:
- Long Term – Neutral
- Mid-term – Neutral
- Short term – Slightly Bullish


