After some dramatic declines, are BTC, ETH & BCH showing signs of recovery? Aug 12
Aug 12, 2018, 2:16pm
Some cryptocurrencies will begin to experience some recovery this week after a hefty bearish run last week. Let's examine how BTC, ETH and BCH do
Having made some dramatic declines in the past week, some of the cryptocurrencies are starting to make a little recovery, having hit previously identified key levels of support. Find out the possible trade setups we will see in the top 3 cryptocurrencies as we kick off the 2nd week of August.
BTC/USD
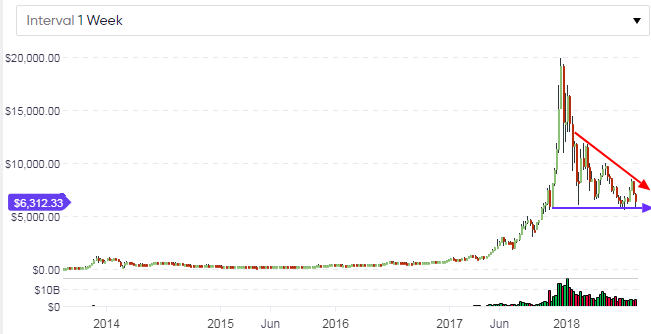
BTC/USD continues to fulfill the long-term expectations on the weekly chart. The previously identified borders of the symmetrical triangle on the long-term weekly chart continue to remain the boundaries of price action. The price has touched the support trendline, but did not break through it with a closing penetration. We are likely to see further tests of this line on the weekly chart heading into the new week. However, range traders on the weekly chart may have started initiating long positions, so the possibility of a break of this trendline is a bit dimmer this week.
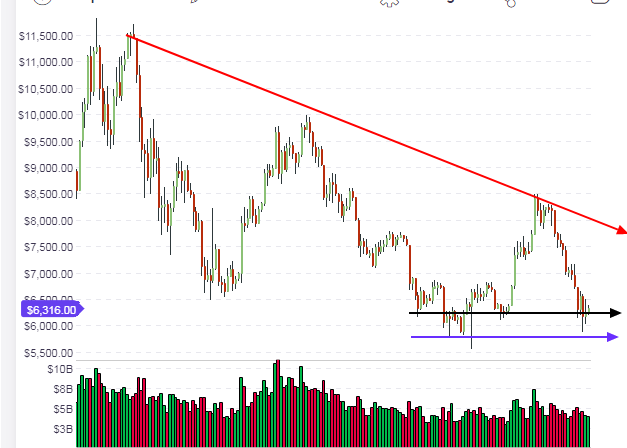
The situation on the daily chart today shows that the expectation of price action that was pointed out in the last analysis piece was met. Price action hovered around the $6,200 mark, was broken to the downside on Saturday, August 11 and came down to about $5,900 (blue horizontal arrow).
However, this level is the support level that has held firm in the last few months, and there have been pushbacks by bulls at this level on several occasions. This time was no different, with the bulls pushing prices back up almost immediately by at least $400 to the $6,300 level. This level has held firm in the last 24 hours (black horizontal arrow). We expect a few more attempts by price to push down below this level, but after this, we expect prices to start tracking back upwards to meet the slanting resistance trendline identified in the weekly chart.
The position on the hourly chart shows that price is basically range-bound between the daily pivot and the S1 pivot. However, a short-term symmetrical triangle has formed.
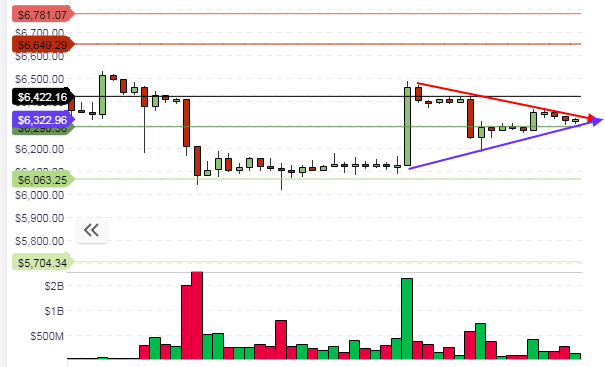
We may, therefore, see prices pushing below S1 to the S2 pivot, or pushing upwards to the daily pivot. The candlestick formations on the pivot points should dictate the direction of trades.
– Outlook for BTC/USD
- Long-term: bearish
- Medium-term: bullish
- Short-term: neutral
ETH/USD
The price of ETH/USD tanked dramatically in the last week, hitting lows not seen in many months. The horizontal support of $358 on the weekly chart has been decisively broken and prices are now heading south in the long term. Presently, there is very little to provide any real support for the ETH/USD pair, except the drag influence of Bitcoin.
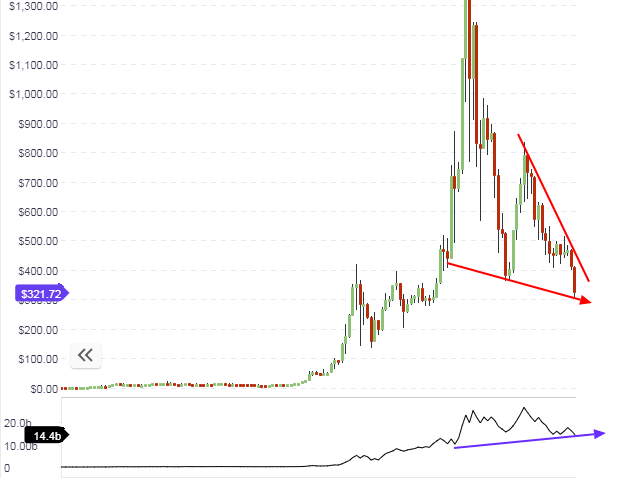
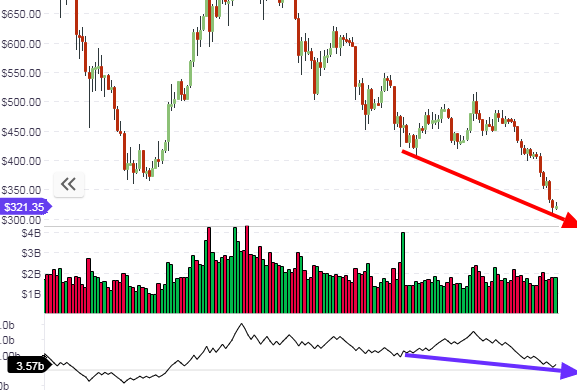
Things moved very quickly from our last analysis, where it was clearly stated that the break of the major support level last seen in April 2018 at $358 would open the door to the $306 support of September 2017. This took place on Friday and Saturday (August 10-11). The price has been able to bounce off this support line and we can also see that there is a divergence that is starting to form on the daily chart. This is in addition to the divergence seen on the weekly chart. So we should see a short-term recovery on ETH/USD medium term.
The hourly chart shows that price action has broken through all the support pivots, and is attempting an upward pullback to the broken S3 support pivot. The price has been rejected here and is making another attempt at the pullback.
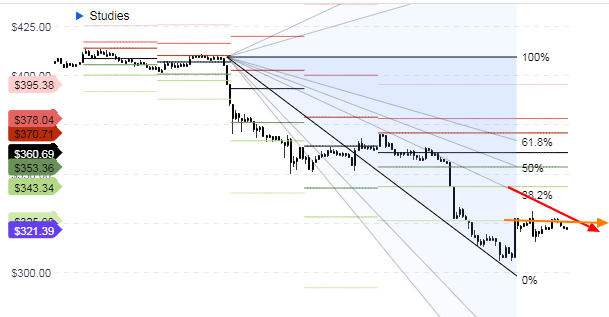
However, we can also see that the 38.2% and 50% Fibonacci fan lines can come into play here, with the 38.2% Fibonacci fan line (red downward arrow) being a key player in the equation. This fan line intersects with the S3 pivot (orange line) and will, therefore, form a key resistance to the further upside for the day. However, if price is able to breach this level to the upside, then we would expect the S2 pivot and the 50% Fibonacci fan lines to become the next possible resistance levels to impact the price action.
Outlook for ETH/USD
- Long-term – bearish
- Mid-term – bullish
- Short-term – bearish
BCH/USD
The long-term support seen on the weekly chart for Bitcoin Cash is still intact, even though it has been put under some pressure by the recent bearishness in the cryptocurrency market. The weekly bar violated this support but did not close below it. But just like its big brother Bitcoin, Bitcoin Cash has posted a recovery of about 4.44% from overnight lows.
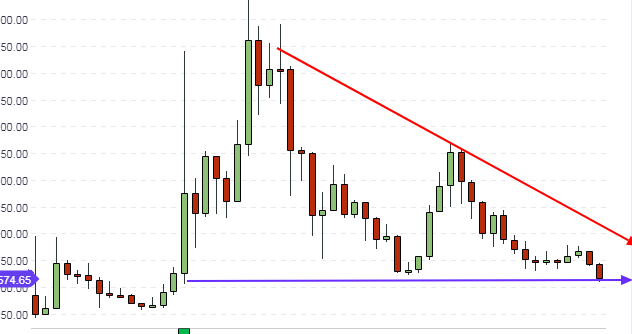
The picture on the medium-term daily chart shows that the previous support area seen in April 2018 has been violated, but a pullback is in the works. This pullback was heralded by the formation of a bullish pinbar and prices have recovered from there. However, there is not enough impetus for large upside movements and the sentiment on the BCH/USD pair is presently still bearish.
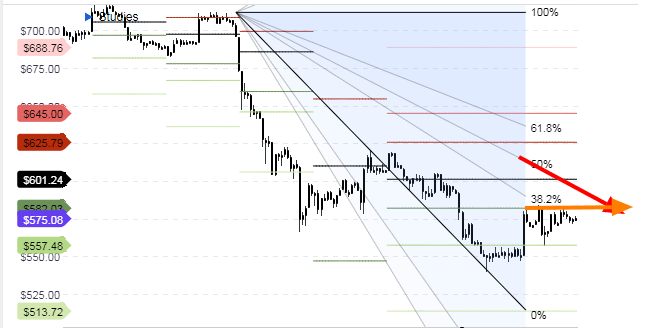
Stepping down to the hourly chart, we see that the pullback of price action mentioned in the last paragraph has been rejected at the S1 pivot. This has happened three times and shows how weak any upside momentum is. We also see the 38.2% and 50% Fibonacci fans coming to play. It is likely that the 50% Fibonacci fan will be more important, as it intersects the S1 pivot at an area into the future where price is yet to attain. Therefore, the evening of August 12, 2018 will reveal whether the S1 pivot will be broken to the upside or not.
Outlook for BCH/USD
- Long-term: bullish
- Medium-term: bearish
- Short-term: bearish


