Bitcoin and Ethereum Nearing Support; Renewed Round of Buying Expected
Sep 09, 2018, 2:00pm
Bitcoin, Ethereum and Litecoin look set for a round of renewed buying this week, after a massive selloff drove prices down to support levels.
The massive selloff in Bitcoin and several other cryptocurrencies continued unabated heading into the weekend, as the markets struggle to find any kind of support. Ethereum continues to be the hardest hit of the top 10 cryptocurrencies, as it currently flirts with the $200 mark. The denial by the Chief Financial Officer of Goldman Sachs about the company cancelling its proposed cryptocurrency trading desk setup did little to project any optimism in the markets. With some of the top cryptos now nearing support levels how will the new week begin for these top cryptos?
BTC/USD
BTC/USD’s weekly chart continues to project the price movements that are expected, trading within the boundaries of the descending triangle seen on this chart. Prices are now nearing support levels, as it currently trades at $6,200. There is still some downside momentum to this crypto pairing, and we could see prices hitting at least the $6000 mark before another round of renewed buying resumes.

Price action is still not close to the apex of the descending triangle, so it is expected that prices will continue the oscillations between the support line (blue) located at the $5,800 to $5,900 area, and the descending resistance line. It must be said that buyers who are entering off the support area are finding it very difficult to force prices to the previous highs attained. Therefore, the long term bias for Bitcoin is for it to hit further lows, except some really strong positive news is able to take it above the descending trendline resistance, which will open the door for some of the upside projections that some analysts are predicting.
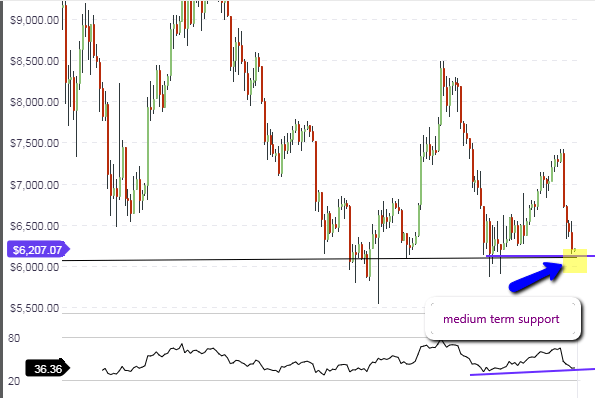
The daily chart shows the selloff that has occurred since Wednesday, and also shows that price action has found support at the medium term support line. This support line can be traced all the way back to the 2nd week of July. We need to see the daily candle below this line for the price action to actually reach the long term support level of between $5,800 and $5,900. If the daily candles for Sunday, Monday and Tuesday do not break this line to the downside, then we may see some stronger buying off this support line. But if the daily candles break this line, then expect the price action to get all the way down to logn term support of $5,800/$5,900 before buying resumes.
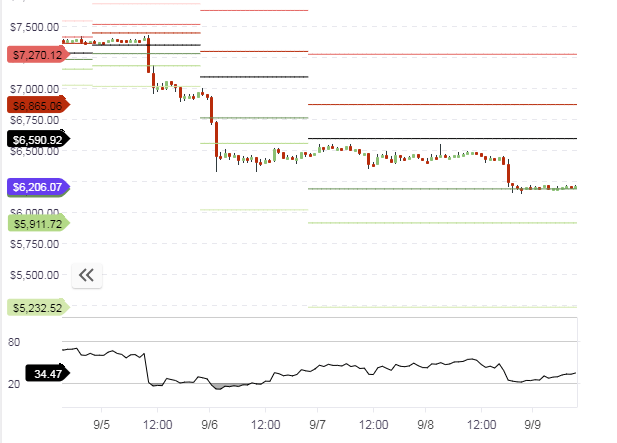
Intraday traders will find focus from the pivot points. Presently, we see that the price action of BTC/USD is trading directly on the S1 pivot $6,205. Price is also limited to the upside by the central pivot point at $6,450. It is therefore likely that price action for the day will be capped at the central pivot, which will represent a good place to sell on rallies.
Outlook for BTC/USD
- Long-term: bearish
- Medium-term: neutral
- Short-term: neutral
ETH/USD
ETH/USD has dropped below the $200 mark and is struggling to find support. The weekly chart shows that ETH/USD has touched the $190 mark, with new support expecting to be found at this price area. The previous support-turned-resistance is located at the $290 mark. This leaves a new long term range between this support area ($190) and the horizontal resistance at $290.
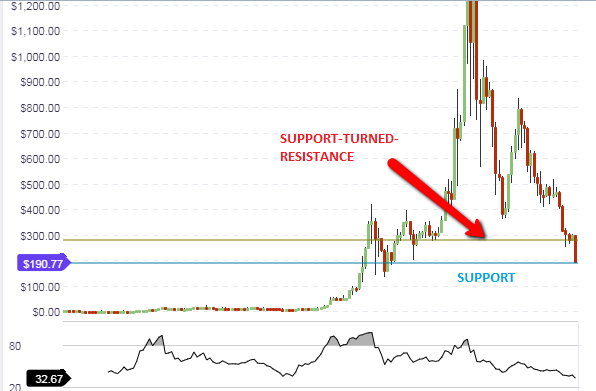
The daily chart reveals that the smaller upward channel contained within the larger downward channel has been broken comprehensively. This leaves the price action pushing towards the lower channel line of the downward channel. However, we also see that the RSI indicator has begun to turn upwards, which makes the likelihood of a divergence quite high.

If this continues, then expect the downward price action to be limited, and for an upside recovery to occur, at least to the identified resistance levels on the weekly chart.
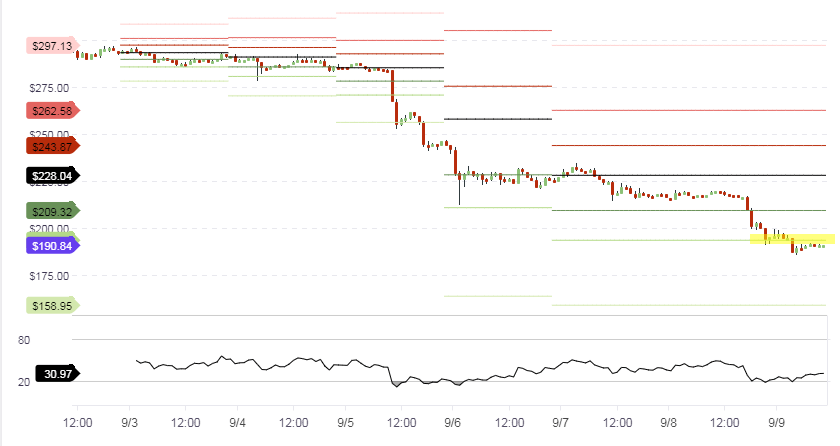
The hourly chart shows that price has broken below the S2 pivot, but the price action has begun to turn up again. It is not very likely that much downside movement to the S3 pivot ($158) will occur, as price has already started to find support at the S2 area ($190.84). Therefore, intraday price action is expected to be located between the S2 and S1 pivot areas.
Outlook for ETH/USD
- Long-term: bearish
- Medium-term: neutral
- Short-term: neutral
LTC/USD
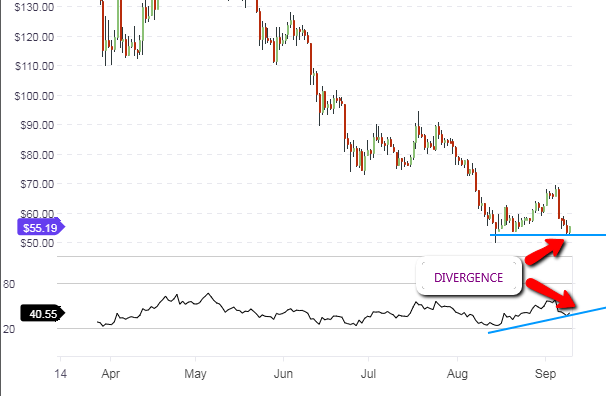
Litecoin was not spared in the selloff that was seen last week. However, we can see from the weekly chart that it is starting to find support at the $52.92 area.

A look at the daily chart below shows that the price action has found support, supporting the view on the weekly chart. We also see that the RSI indicator has begun to turn upwards to create a divergence situation. Therefore, price is expected to correct this divergence in the first few days of the week. We therefore expect some upside occur during Sunday and Monday’s trading sessions.
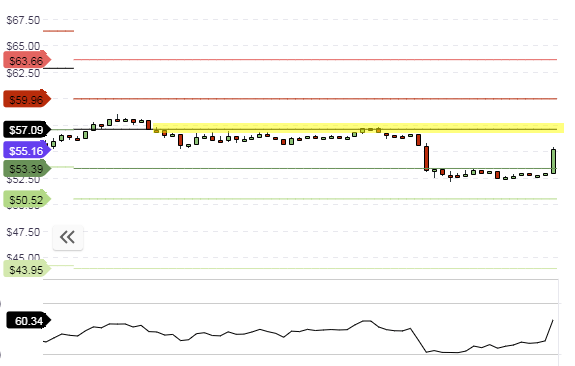
The picture on the hourly chart shows that the price action is currently pulling back up above the S1 pivot area. Price action should therefore trade between the S1 pivot and the central pivot. However, the central pivot may be too strong for price action to break for the day. A lot of what will happen to LTC/USD is contingent on the price action of BTC/USD. So intraday traders should watch to see what happens on the BTC/USD pair, and draw inspiration from there.
Outllok for BTC/USD
- Long-term: bearish
- Mid-term: neutral to bullish
- Short-term: neutral to bullish


