
Bitcoin Endures a Wild Night of Trading, Ethereum Maintains Its Daily Range: Sep. 20
Sep 20, 2018, 11:50AMBitcoin has a crazy trading night with a quick dip-bounce move in 15 minutes, as Ethereum continues to trade within daily ranges for the week
Bitcoin and other cryptos continued into the midweek in range bound mode, until a shock dip-bounce move saw BTC breaking the $6,250 - $6,350 intraday range which had been predominant for at least 2 days in the market. Prices have cooled off since, and prices have retreated back to the range levels.
So what does the crypto market hold for traders as we head into the middle of the third week of September?
BTC/USD
BTC/USD’s long-term chart shows that the weekly candle has formed a small pinbar with a small range. This candle is midway between support and resistance, and there is basically equillibrium between buyers and sellers. The long-term outlook has not changed; prices are still expected to trade between the support and resistance levels until there is market news that will push prices beyond these levels.
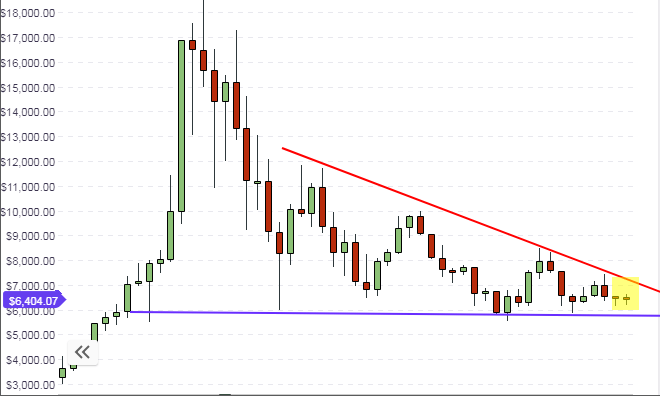
The daily chart shows that there is some medium-term buying pressure, depicted by the green volume bars. Yesterday’s price move is showcased on the chart, but bullish price move has basically stalled. The support line is rising, which shows that the medium term support has been steadily going up from $5,800 to $6,050. Medium term traders can aim to buy off support levels if prices are pushed down by whales to this level.

As discussed previously, careful attention must be paid to the candlestick patterns that form at the support area, as they will give a clue as to what price action will look like. Presently, it would appear that some high net-worth investors are deliberately forcing prices down to lower levels so they can purchase larger units at cheaper prices. Follow the whales when this occurs.

For intraday traders, the focus for trading must be on the pivot points. Price action is pushing off the central pivot, which gives the intraday bias for the crypto pair as bullish, Prices are expected to bounce off the central pivot point and stay within the range formed by the central pivot and the R1 pivot. However, trading this range will depend on it staying intact, which means that if any of the candles breaks below the central pivot or above the R1 pivot, this range will be invalidated.
Outlook for BTC/USD
- Long-term: bearish
- Medium-term: neutral
- Short-term: neutral to bullish
ETH/USD
ETH/USD remained mostly unmoved by yesterday’s night volatility on BTC, as well as other pairs associated with Bitcoin such as Litecoin and Bitcoin Cash. With no news for this cryptocurrency, it continues to sit on the lower end of the long-term range, forming a pinbar which is sitting squarely on the support line. If the candle closes this way when the week comes to an end, then we would expect ETH/USD to start showing some upside movement in the weeks to come.
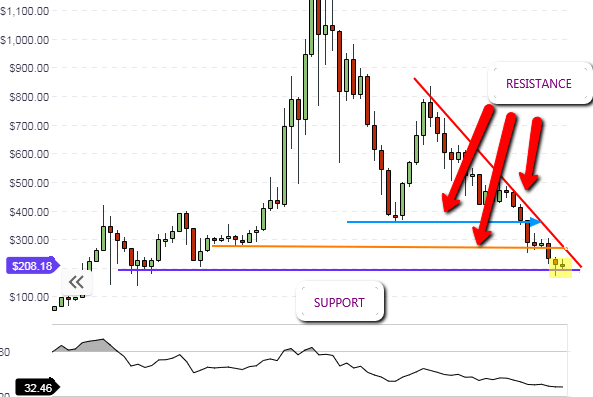
The daily chart shows the divergence situation, which is starting to correct. Presently, price is caught in between the trendlines that form a symmetrical triangle. This triangle typically indicates a continuation of price move, therefore it is possible that the resolution of this triangle will produce a continuation of the correction of the price divergence, resulting in an upside move. However, the price candle must close above the triangle’s upper trendline for any upside moves to be confirmed.

The hourly chart reveals the symmetrical triangle in a clearer manner, with price action presently being limited by the upper trendline (red colour) which is found midway between the central pivot and the R1 pivot. We also see prices limited to the south side by the blue support line, which intersects with the central pivot.
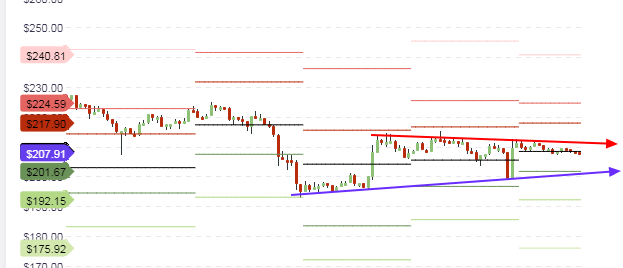
If the price levels are not broken, then price action will possibly trade between the two trendlines for the next few days, in which case range traders may consider buying at support and selling at resistance. But if any of these price levels are broken, then traders should trade the breakout by waiting for a price pullback after the break. This will ensure confirmation of the breakout moves beyond the identified intraday price ranges.
Outlook for ETH/USD
- Long-term: neutral
- Medium-term: neutral
- Short-term: neutral
XRP/USD
The long-term outlook for XRP shows that price is still expected to trade within the upper and lower limits of price action which represent the same limits that have existed since May 2018. Ripple benefitted from a 10% price jump last week after having traded at long-term support for quite some time.
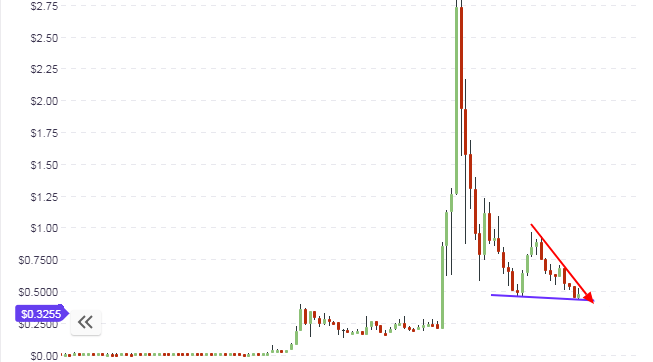
Presently, Ripple is trading at the long term resistance level, and it would need some strong news to boost buying pressure for it to be able to break above the current resistance level.
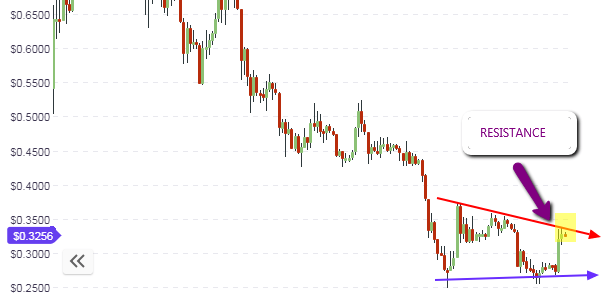
The daily chart shows the picture on the long term chart more clearly. We can see prices presently being rejected at the resistance. If there is no positive or negative news to trigger strong buying or selling of this crypto, then the XRP/USD pair can be expected to trade between the resistance line (red) and the support line (blue). If this is the case and price continues to be rejected at the resistance after several tests, then medium term selling may resume so as to send prices down to the support levels.
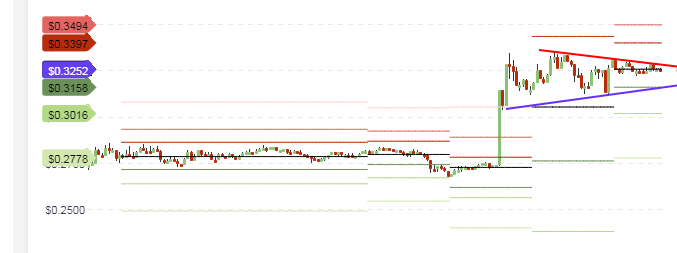
The hourly chart shows price trading at the central pivot level of $0.3252. Prices are not expected to break above this level if there is no positive news for the day. Therefore, price action is expected to push lower to the S1 pivot level and to stay within the range formed by the trendlines shown on the chart.
Outlook for XRP/USD
- Long-term: bearish
- Mid-term: bearish
- Short-term: neutral to bearish
Disclaimer: information contained herein is provided without considering your personal circumstances, therefore should not be construed as financial advice, investment recommendation or an offer of, or solicitation for, any transactions in cryptocurrencies.


