Bitcoin, ETH, XRP, BCH, LTC & EOS Market Analysis: July 22, 2018
Jul 22, 2018, 2:16PMBTC tested the resistance level at $7,450 buyers tried to send prices up, but sellers forced them down. What about the other top 5 coins?
What a topsy-turvy week it has been for most of the top cryptocurrencies. As identified in our latest cryptocurrency analysis, the upside moves we saw on BTC, LTC, ETH and other top cryptos were not really upside reversals, but rather upside retracements from the existing downtrend. As will be disclosed in today’s analysis, price action attempted to make further upside push on several cryptos, but could not find the momentum to break out of the ranges in which they have traded for the past few weeks.
As we head into a new week of trading, what can we expect from the top 6 cryptocurrencies?
BTC/USD
BTC/USD tested the resistance level identified in the last analysis at the price of $7,450. After testing this area several times, buyers began an ambitious push to send Bitcoin prices above this resistance, but sellers aggressively forced them down. We see this on the long doji candle on the hourly chart below.

At the end, the resistance level of $7,450 is still intact, and with the formation of a pinbar candle at this resistance level on the daily chart as a result of the failed move, it is hard to see if prices can rise further in the coming days.
Failure or price to push above this resistance will see prices headed downwards towards the floor prices of between $6600 and $6700.

Any upside break of the resistance, which looks set to be tested again if the intraday charts are anything to go by, will see prices now pushing to the next identified resistance at well above $8,500.
ETH/USD
The ETH/USD pair failed to complete the potential double bottom. However, the daily chart throws up some interesting details.

May to June saw a falling wedge pattern form on the daily chart. Typically, a falling wedge that takes this long to form will also produce a long-term bullish price resolution. However, the price is presently found within an upward channel. We will need to see the price action break above the upper channel line, accompanied with an increase in buying volume, in order for the bullish outcome of the falling wedge pattern to be felt in the market. Of course, this is also consequent upon the break of the medium term resistance at $550.
Intraday charts show price trading between the central pivot and the R1 pivot, with price gradually inching towards the R1 pivot.

If the short term resistance or the R1 pivot is broken, then we should see price movement to the upside, which would also correspond to the move of price towards the upper channel line seen on the daily chart.
XRP/USD
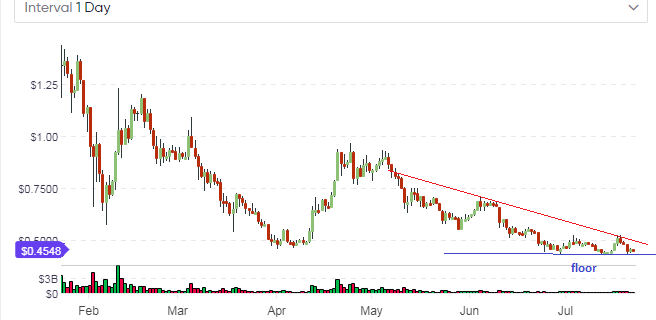
The long-term focus for Ripple has not changed. Upside is still limited by the descending trendline, which is starting to push hard at the floor price of between $0.39 and $0.42, depending on which exchange you are getting your price feeds from.

Intraday trading volumes are extremely thin and the price is ranging very tightly between the central pivot and the R1 pivot line.

So far, the central pivot is holding up against downside pressure. How long this will continue is doubtful. Any intraday trades will have to be within the context of the central pivot. If it continues to hold up (i.e. the price bar does not close below it), it will serve as the basis for short term bounce trades to the upside. However, this is risky as it goes against the prevailing trend. It may be better to wait to see if the central pivot is breached. Bitfinex has the central pivot at $0.45. Please use the proper pivots that match your exchange’s price feeds.
BCH/USD
As identified in our last analysis, Bitcoin Cash was unable to sustain its brief upside push beyond the June resistance (purple horizontal line) at the $908 mark.

As far as long tern charts are concerned, BCH is now in a channel, which resembles a bearish flag formation when the prior downtrend extending from Q1 2018 is considered.
We therefore expect prices to be confined to the flag, provided the trendlines that make up the flag are not breached. Bias is to the downside, so watch for a downside resolution of this price formation in the coming weeks.
For day traders, it is pertinent to mention that price has tested the intraday central pivot at $772.10 several times.

If this level is violated to the downside, expect prices to push towards the S1 pivot of $731. If not, then prices will range between the central pivot and the R1 pivot, barring any positive news for the cryptocurrency.
LTC/USD
Our analysis last week showed a potential for a double bottom formation, but we added a proviso: a closing penetration above the neckline had to occur for this pattern to be deemed complete. However as we can see from the daily chart below, the price did not have the required momentum to achieve this upside closing penetration. Rather, a bearish pinbar formed at the neckline, which truncated any hopes for an upside move and sent prices back into the downward trend.

Prices have started to trend downwards again, but intraday trading charts shows the price of LTC/USD moving in a sideways trend between the central pivot point and the R1 resistance pivot.

For Sunda,y July 22, it is expected that price would trade in a tight range between the central pivot and the R1 line, assuming that the respective key levels would hold firm. Price has already tested the central pivot several times at $79.58. If this level is breached, then expect the price to push towards the S1 pivot line of $77.50.
EOS/USD
The daily chart for the EOS/USD confirms our medium-term view on the EOS/USD asset, which is that the downtrend will persist. This is because of the descending upper trendline which has continued to limit the upside. At the time of our last analysis, the price was at 8.6022, but this has declined to 8.0609. The presence of the bearish pinbar at the trendline confirmed the downtrend.

There is very little on the fundamental side to support an upside break of this trendline. Buying volumes are still very thin and we will see more selling in the next 2-3 days, as long as the descending trendline is not violated.
The 4-hour chart reveals that a symmetrical triangle is in formation. With the asset in a downtrend, the bias is for the price to break downwards.

We expect the price to push down from current levels at the upper trendline bordering the symmetrical triangle. If the price is able to breach the lower trend line identified above, accompanied by an increase in selling volumes, then EOS/USD should be pushing to the long term support at the 6.6000 – 6.7300 area. Price moves will depend on what happens at these trendlines, but the bias remains bearish.
Disclaimer: information contained herein is provided without considering your personal circumstances, therefore should not be construed as financial advice, investment recommendation or an offer of, or solicitation for, any transactions in cryptocurrencies.


