
XRP, BTC & ETH Semi-Bounce Back after Last Week's Bloodbath: Market Analysis, Aug. 21
Aug 21, 2018, 11:23AMWhat effect will the U.S. SEC decision on the pending approvals of ProShares Bitcoin ETF and the ProShares Short Bitcoin ETF have on cryptos?
With the US Securities and Exchange Commission (SEC) set to make a decision on whether to approve the ProShares Bitcoin ETF and the ProShares Short Bitcoin ETF on Thursday, August 23, cryptocurrency markets are now trading in a range. Many cryptos have bounced off their support levels after last week’s bloodbath, but are yet to reach new highs.
So what is the outlook for three of the top cryptocurrencies as we prepare for the SEC decision in 2 days?
BTC/USD
The weekly long-term chart for BTC/USD shows that the price is still in the range that has been identified for quite some time now. After touching the support level of $5,700 last week, the weekly candle closed with the formation of a pinbar. So far, Bitcoin USD has made some upside gains off last week’s lows, and is now trading at slightly above $6,430. This was after some overnight selling that pushed the price down to the $6,100 level.
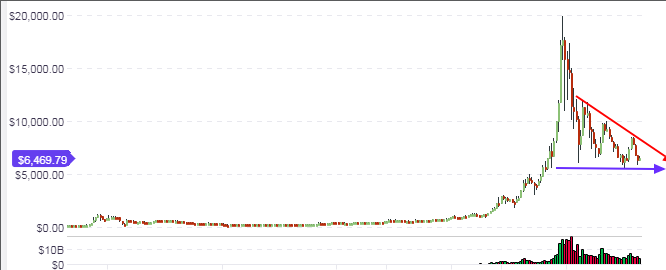
It is apparent that investors are cautiously awaiting the SEC decision so as to decide on what to do with their positions. Positive news from the SEC (i.e. approval of the two ETF applications) could be positive for the BTC/USD in the long term. In the meantime, price action will continue to oscillate between the ranges found between the support at $5,700 (blue-colored line) and the descending resistance line (red-colored line).
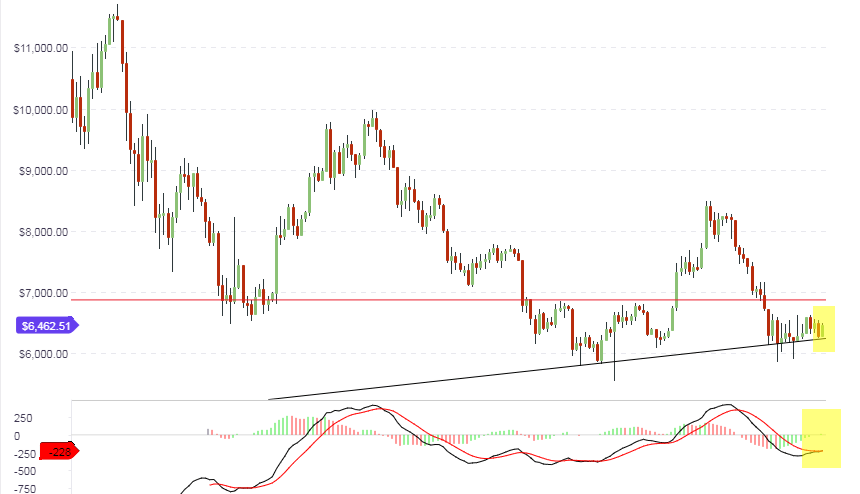
The picture on the daily chart shows that the price action has bounced off the medium term support, but is not expected to make too much of a push to the north as there is a resistance line at the $6,800/$6,900 area, which is going to provide some upside limitation. Again, it will take some positive news in the crypto markets to push prices beyond this resistance area. All eyes are on the SEC announcement on Thursday before we can see this resistance area undergo a possible challenge from the bulls. Negative news from the SEC may see a selloff which will challenge the rising support line (black colour).
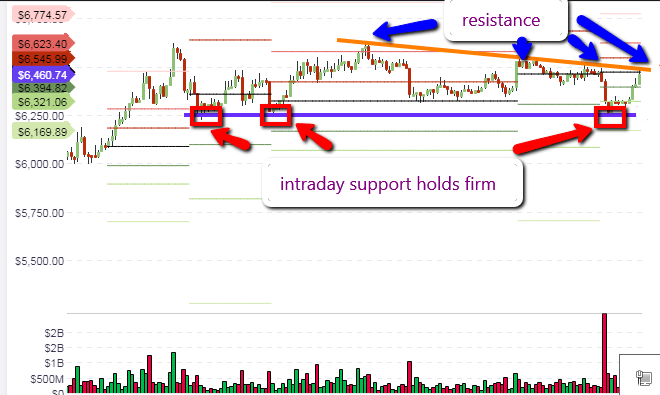
The intraday chart reveals that the price action has respected the intraday support level at $6,250, and has made a bounce from there. However, there is a short term resistance line which intersects the central pivot, where price action has encountered a resistance. It is expected that price action will test this area several times within the day, but will have to break above this pivot line in order to push for the next available horizontal resistance area that corresponds to the R1 pivot line. Therefore, intraday positions will have to be made by considering the behavior of price action at the mentioned pivot points as well as the horizontal support and resistance areas.
Outlook for BTC/USD
- Long-term: bearish
- Medium-term: bearish
- Short-term: neutral to mildly bullish
ETH/USD
Ethereum prices have continued to take a hammering, dropping to as low as $260 in an overnight selloff. However, prices have started to recover once more and continue to hover around the $280 support level. The ETH market is still being dominated by the selloff of bonus tokens acquired from ICO pre-sales in 2017 and early 2018 by whales, who then sell off the ETH to convert them to fiat in order to cash out their bonus holdings.
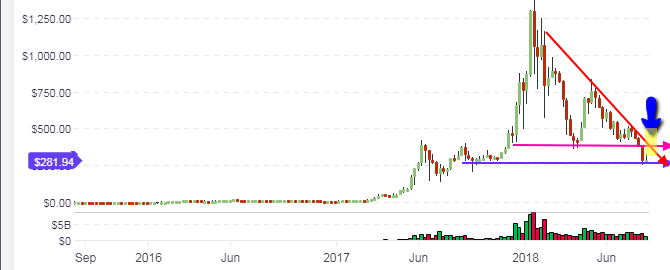
The blue arrow points to an interesting picture on the long term chart. The support level at $280 still holds, but any further upsides are extremely limited, going by the position of the resistance trendline. This trendline also intersects the horizontal support-turned resistance line (marked in pink), which makes this point a very strong resistance. For ETH/USD to break this barrier to the upside, a strong fundamental shift needs to occur in the market. This could come from the US SEC decision on Thursday, August 23, assuming it turns out positively.
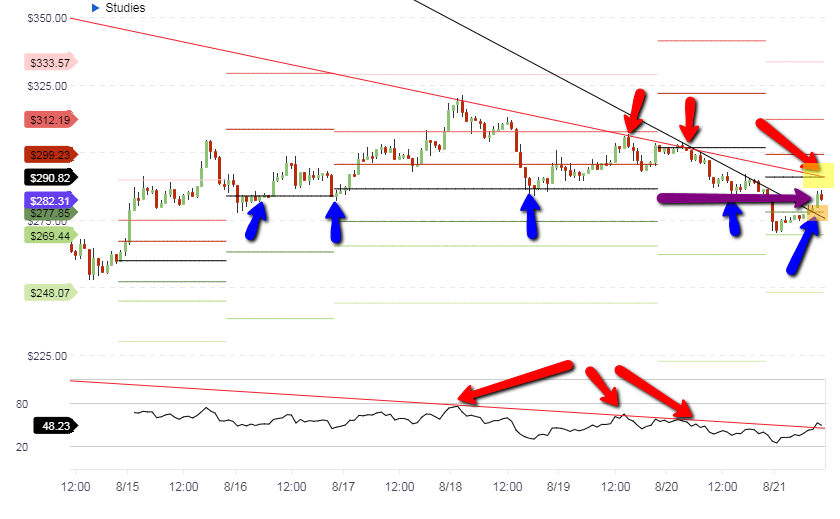
The intraday chart shows a very tight picture. One one hand, we have prices which have broken the slanting black resistance line which has served as the diagonal resistance, now turned support. This line intersects the S1 pivot, and has served as an area from where price action has bounced, following an upside move from the low of $260 recorded at the S2 pivot. On the other hand, we also see a resistance line (red) which intersects the R1 pivot. This could be a resistance area to watch for during the day. We also see a horizontal support line at the $285 area, which has served as a point at which price has bounced several times, dating back to August 17. Incidentally, the hourly candle has found resistance at this line. So the intraday picture is one where price action of ETH/USD will most likely be range-bound between S1, the horizontal support now turned resistance at $285, and the central pivot at $298. Candle breaks or failure of breakout action should be used to determine entry and exit setups at these areas.
Outlook for ETH/USD
- Long-term: bearish
- Mid-term: bearish
- Short-term: neutral
XRP/USD
Ripple has generally profited from the mild recovery that has been posted by altcoins across board. The long term chart shows that XRP/USD will remain confined in the borders that have been identified (blue horizontal support line and red descending resistance line). However, it has also been noticed that the price action channel located within these boundaries may become significant in the future if Ripple breaks the support area.
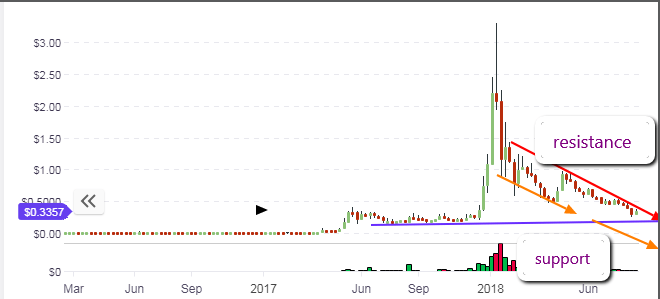
The daily chart shows the channel in a much clearer manner. Price is presently aiming for the upper channel trendline. We can also see that the resistance line located at the midpoint of the RSI indicator is within sight, but has not been attained by the RSI line.
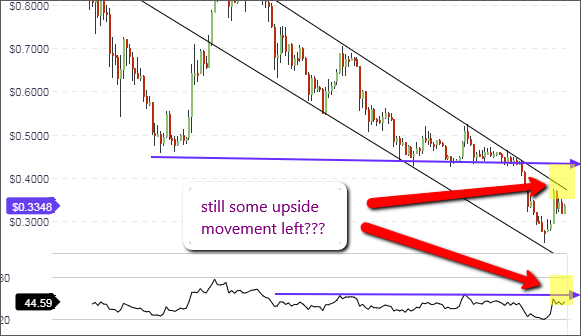
It is expected that in the medium term, price action will aim for these two areas. However, it is hard to see what impetus or momentum that Ripple will have to be able to break above these key resistance areas. Barring any surprises from the US SEC decisions on Thursday, August 23, we should not be surprised if the bears are simply waiting in the wings to sell this rally at the identified resistance areas.
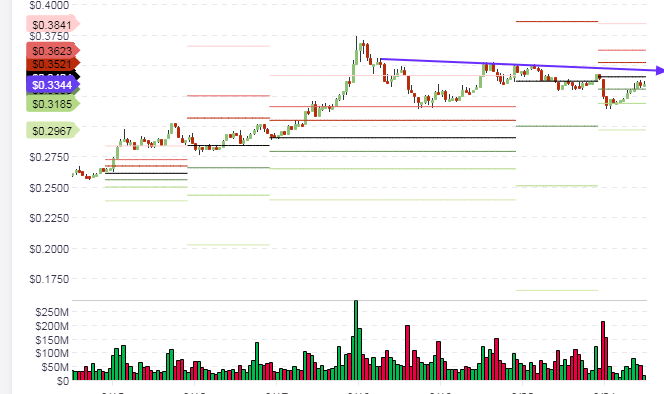
Price action is expected to be resisted at the central pivot area when looking at the XRP/USD from an intraday perspective. This is also close to the near term resistance that has been seen on intraday setups throughout the week. Therefore, bears may be waiting in the wings to sell at these areas, assuming that there is no closing penetration of price to the upside beyond these points.
Outlook for XRP/USD
- Long-termm: bearish
- Medium-term: bearish
- Short-term: neutral to bearish
Disclaimer: information contained herein is provided without considering your personal circumstances, therefore should not be construed as financial advice, investment recommendation or an offer of, or solicitation for, any transactions in cryptocurrencies.


