Bitcoin and Ethereum Still Trading in Tight Ranges: Market Analysis Sep. 27
Sep 27, 2018, 1:25pm


Bitcoin and Ethereum are still trading in tight ranges, even as Ripple looks set to consolidate the gains of last week with another price burst.
Bitcoin, Ethereum, Bitcoin Cash and other top cryptos continue to struggle to attain any upside. The weakness seen in these cryptos this week can be directly linked to the release of a circular by the entity in charge of the Mt.Gox liquidation process, detailing the sale of more than $230 million worth of Bitcoin and Bitcoin Cash in the crypto markets between March 17 and June 22 this year. The announcement, which was posted on the Mt.Gox website on September 25, 2018, led to a drop in the price of Bitcoin from the week’s open of close to $6,700 to as low as $6,280.
However, prices have begun to pick up again, albeit very slowly indeed. So what does the rest of the week hold for three of the top cryptocurrencies?
BTC/USD
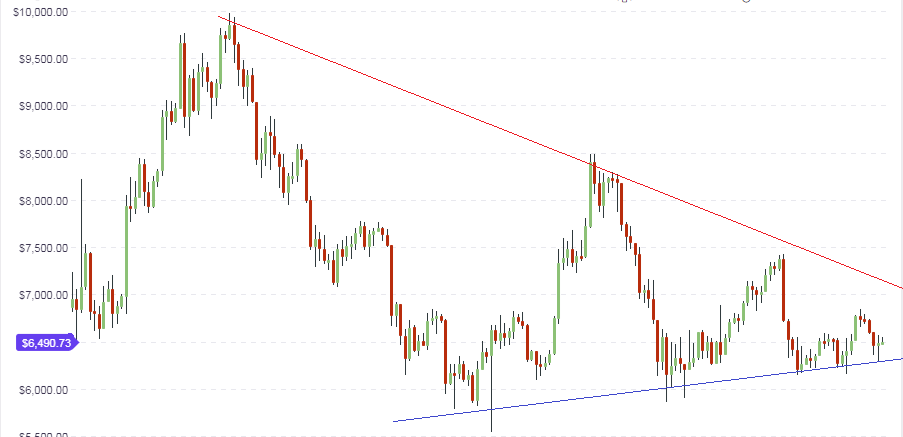
BTC/USD continues to remain within the identified ranges of 2018, limited to the downside by the horizontal trendline at $5,800 and to the upside by a descending trend line which caps the progressively lower highs. This trendline resistance is expected to limit any upside price moves at the $7,000 mark. So far, Bitcoin prices for the week have continued to struggle, with the weekly candle forming a pinbar. The outlook remains intact with prices expected to hit the resistance before turning back downwards, in the absence of any market news to sustain price movements beyond the $7,000 mark. However, any further upside moves may take a while to play out, if we continue to see the sluggishness of the bulls that has played out so far this week.
The daily chart shows that the price action is still contained within the resistance and support lines displayed on the charts. Price is closer to the blue support line than it is to the red resistance line. Traders who want to profit from bullish moves on Bitcoin using the medium term charts may have to allow some downward price push to the support line at the $6,200 area, so they can profit better from a bounce off this support line.
For intraday traders, the focus for trading continues to be on the pivot points as well as the intraday support and resistance areas formed by previous price highs and lows. Presently, we see Bitcoin prices limited to the upside by the intraday resistance line, which is located at around $6,550, and also to the downside by the central pivot at $6,454.
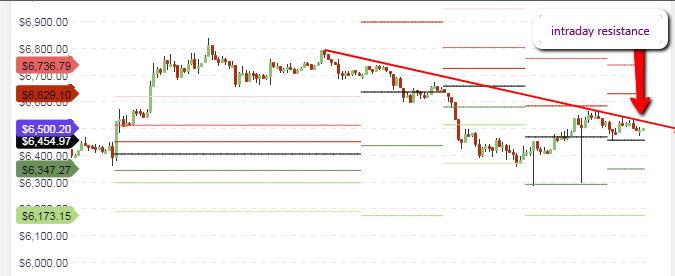
The price of BTC/USD has already bounced off the central pivot twice. If the central pivot continues to hold and the upside resistance holds as well, these two price areas will form the basis of the range trade for the day. However, intraday traders need to watch to see if these price areas will be broken or not, so as to determine how to set their trade entries. If the resistance is broken, then price will make a push to the R1 resistance area at $6,629. If the central pivot is broken, then prices will push to the S1 pivot at $6,347.
Outlook for BTC/ULong-term
- erm: bearish
- Medium-term: neutral
- Short-term: neutral
ETH/USD
Ethereum has continued to remain resilient in the face of the current struggles being experienced by Bitcoin and other Bitcoin-linked assets, and continues to hold above the $190 support level. The weekly long term chart shows that the weekly candle has formed a pinbar which is solidly sitting on the present support levels. This is the third successive pinbar being formed on the weekly candle and if the candle ends this way for the week, we may Ethereum making a case for a strong push upwards in the weeks ahead, at least to the next resistance level at the $290 mark (orange line).
The price action on the daily chart reveals the formation of a bearish flag pattern, with prices pushing hard against the lower trendline support on the flag pattern. In the medium term, this pattern is expected to resolve by breaking below the support line to the downside, from where support is likely to be found at the long term support area of $190. It is also likely that price action will continue to trade within the confines of the flag itself, if the breakout fails to occur this week. Medium term traders of ETH/USD need to watch the situation very closely so as to make the correct trading decisions.
On the intraday charts, we see that the pivot points and the previous highs and lows of intraday price action continue to remain the relevant reference points for price movements for the day. Price has turned downwards from the central pivot and is aiming for the S1 support pivot, which also marks the area where a support trendline traced along the previous daily lows is expected to run across.
This support line/S1 pivot line will be tested by intraday price action. If it holds firm, then prices will bounce from there and aim for the central pivot. If this support area is broken, then expect price action to push towards the S2 pivot mark at $201.82.
Outlook for ETH/USD
- Long-term: neutral to bullish
- Medium-term: bearish
- Short-term: neutral to bearish
XRP/USD
Ripple made a surprise jump last week after the falling wedge on the long term chart resolved. After the breakout candle completed last week, this week’s candle took off to the upside following a bounce off the long term horizontal resistance-turned-support line. This line was actually a previous support for several weeks before it was broken to the downside. The current weekly candle has assumed a pinbar shape, and is sitting squarely on the support line.
The daily chart shows the picture a bit more clearly. We see price action contained within a very steeply formed symmetrical triangle, with the latest daily candle assuming the shape of a pinbar which is sitting on the horizontal resistance. With three days left in the trading week and with price action already very close to the apex of the symmetrical triangle, it is very likely that we will see this triangle resolve in the next few days either to the upside or downside. Symmetrical triangles are usually continuation triangles With the previous price action coming from the south, the chances of an upside resolution appear higher at this point, but this must be followed by an increase in buying volume. Presently, the predominant volume of trade in the market is coming from the sellers, so traders who want to trade medium term on Ripple have to watch the situation closely.
The intraday charts reveal that intraday trading volume is very thin, leading to price being stuck in very narrow ranges. Price is expected to be limited between the central pivot below, and the resistance trendline above.
The situation can be likened to a calm before the storm. A breakout looks imminent. Intraday traders are advised to wait to see the direction of the break before taking action.
Outlook for XRP/USD
- Long-term: bullish
- Mid-term: neutral
- Short-term: neutral


