Bitcoin, Ethereum and Bitcoin Cash Showing Upside Momentum: Market Analysis Sep. 23
Sep 23, 2018, 2:53pm


Bitcoin, Ethereum and Bitcoin Cash post overnight gains, as the major cryptocurrencies start their approach to long term resistance levels
Bitcoin and other cryptos have resumed their upside movement after several days of lethargy and consolidation. However, these upside moves are not full reversals, but can be considered as rallies in a downtrend. These rallies are expected to continue as the new week commences before prices get to their resistance areas when the week draws to a close.
So what does the crypto market hold for traders as we head into the last week of September?
BTC/USD
BTC/USD’s long-term chart shows that the weekly candle has picked up steam and is bullishly heading towards the red resistance lines. This resistance line is formed by progressively lower highs, therefore it is likely that the long-term resistance may not go beyond the $7,000 mark. Price is currently $250 below this level, so we may see this resistance area being tested before the week runs out if the bullish momentum of the last three days is sustained.
The daily chart shows that the price action is pushing towards the resistance line, seen on the chart as the red line that caps the progressively lower highs. The yellow shaded area represents the area where price action is expected to touch the resistance line, which is just around the $7,000 mark. Absence of any positive news to push Bitcoin prices beyond this point will mean that sellers will perform what they have been doing for the greater part of 2018; selling at the resistance line. Traders must watch the order books for an increase in sell orders on the major exchanges as this is a clear signal to sell, especially if prices are close to the $7,000 mark. This could happen as early as this week.
![]()
In addition, careful attention must be paid to the candlestick patterns that form at the resistance area, as they will give a clue as to the exact trigger price at which to sell. Vigilance is advised, especially for those who are already in long positions to profit from the rally.
![]()
For intraday traders, the focus for trading continues to be on the pivot points. Day traders have to exercise maximum caution this week, as price action starts to approach the long-term resistance. This is no longer the time for day traders to leave long positions unattended to. But for the day, price is presently capped at the $6,754 mark and we also see a support line propping up prices from below. We have to see price action closing above the intraday resistance level of $6,754 for further continuation of the bullish march to the identified resistance level. It is best to allow price action to decide on what moves should be made on an intraday basis.
Outlook for BTC/USD
- Long-term: bearish
- Medium-term: neutral
- Short-term: neutral
ETH/USD
ETH/USD continues its slow march to the upside as it continues its slow recovery from the lows of the last two weeks. The second most valuable crypto in terms of market cap is currently trading at $247, and finds itself now targeting the $290 resistance level above, marked by the intersection of the horizontal resistance line (orange line) and the descending long term resistance line (red).
The price moves on the daily chart are also a continuation of the price correction of the divergence that formed on the charts in the month of August. However, price action is getting close to where the resistance levels are. This could play out within the week.
![]()
Not much activity is expected to occur on an intraday basis, as price action is expected to trade in narrow ranges. Intraday traders should follow the price activity on the daily chart with a view to selling on rallies to the resistance areas within the week.
Outlook for ETH/USD
- Long-term: neutral
- Medium-term: neutral
- Short-term: neutral
BCH/USD
Bitcoin Cash has also benefitted from the recent gains of Bitcoin, and this crypto is now trading at the $505 level. The long term chart shows that the price action has bounced well off the lows of the weekly chart. The focus is now on the march towards the resistance areas which are within reach.
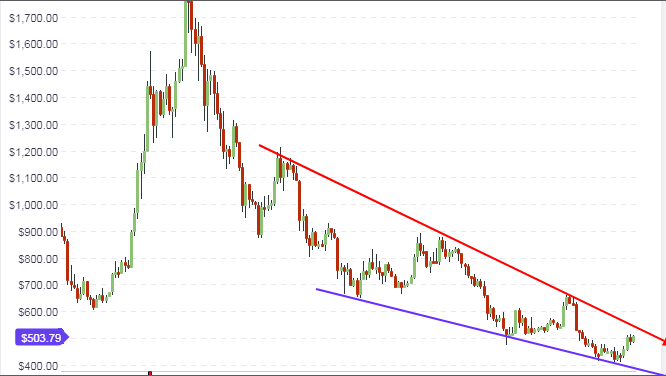
The daily chart paints a clearer picture. The chart shows the presence of a falling wedge pattern, with some upside room between the price action and the descending trendline resistance line (red). Price action is expected to trade within the confines of the falling wedge, as there is not enough bullish momentum yet to push prices above the trendline resistance and into an upside breakout mode.
The initial horizontal resistance on the daily chart is at the $590 mark, which also corresponds to the area where the descending trendline meets the resistance line that was formed by a broken support line at the same price. Prices are expected to test this level and if there is still no positive news in the crypto market to drag up prices above these levels, we may see sellers entering into the fray. Traders should carefully watch the order books on the exchanges to see when a mass of sell orders have started to flood the market.
![]()
The hourly chart shows price trading very close to the intraday resistance line at $508, with a rising support line propping up prices from below. Price action has to break above the intraday resistance to continue the upside push to $590. Until this happens, price action may continue to trade within the range of $486 and $508, which mark the boundaries of the trendlines shown on the intraday chart.
Outlook for BCH/USD
- Long-term: neutral
- Mid-term: neutral
- Short-term: neutral


