BTC is Finding Support at the $6,480 mark, as NEO and NEM Approach Key Support Levels
Oct 28, 2018, 3:31pm
BTC is coming back into focus as it maintains the $6,480 support level, while NEM and NEO also approach key support levels.
Attention seems to have once again turned to Bitcoin in the light of its tepid but important price action in the last week. Some experts are even predicting major breakout movements. Still, with two months left in the year, Bitcoin is still nowhere near the 2017 highs. Before you put all your eggs in one basket, let’s see what else the market has in store for investors.
BTC/USD
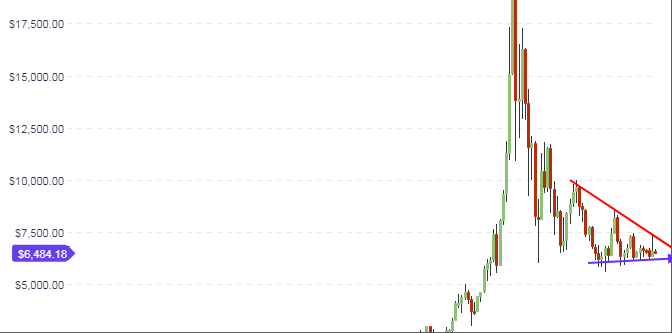
The long-term focus as displayed on the weekly chart for BTC/USD remains unchanged. BTC continues to have as its long-term floor, the $5,800 price level, with the $7,200 level continuing to remain as the long-term price ceiling.
The daily chart below paints an interesting picture. The price action of the last two weeks has respected the $6,400 to $6,480 price level as a support. This is an area where price action has found support and resistance (in role reversal following candle breaks) sequentially in 2018. Now price seems to have settled into this area in the medium-term. For those who want to trade BTC/USD with a medium-term focus, this price level may continue to be significant.
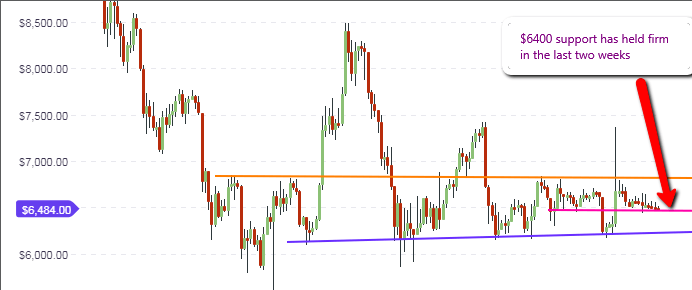
So what happens now? We are seeing the $6,480 price support being tested very frequently. There are two possible scenarios here. The support may simply give way to the selling pressure, which will open the door for price to once more test the long-term support areas of 2018. This will mean a test of the $6,000 area, and then the $5,800 after that if downside pressure persists. Then of course, some bargain hunters may see this as a cheap area to add to their BTC holdings. This will push prices upwards to the identified long-term resistance areas. This week’s price action may hold the key to which scenario will eventually play out.
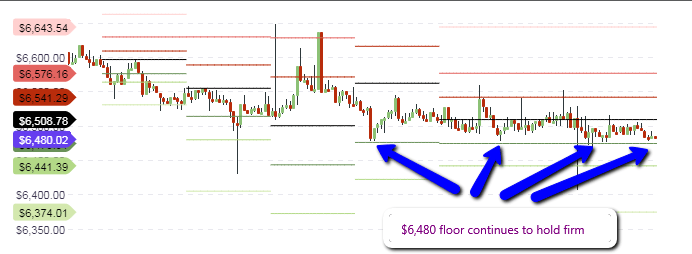
Price action on the daily charts continues to remain choppy,but still continues to respect the $6,480 price level. Today, this price area is seen as the S2 support pivot, which is expected to provide the lower end of the range for the day’s price movement. Prices for the day are expected to peak at the central pivot of $6,508. However, traders must very carefully watch the behavior of the price candles/bars at these two areas. Remember that two weeks ago, traders woke up on Monday morning to a market surprise. This therefore calls for alertness to know when the price action is staging a breakout of any of these key areas.
Outlook for BTC/USD
- Long-term: neutral
- Medium-term: neutral
- Short-term: neutral
XEM/USD
NEM has retreated to the 9.4 cents area, with the current daily candle springing from the trendline support within the context of price movements that have formed a symmetrical triangle. This price move is therefore working according to expectation.
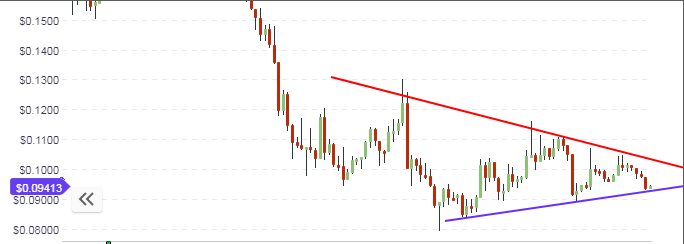
The price candle for the day is expected to remain bullish, and should provide the impetus for price to be lifted from the 9 cents area to the next price resistance at just above 10 cents. As price nears the convergence point of the trend lines, the expectation is that the price will continue to trade within this range until a candle breaks above or below the triangle’s borders. This will then determine the medium term price action for NEM.
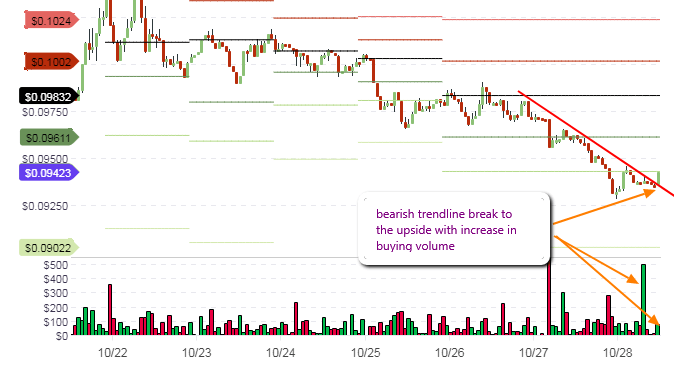
Price action on the intraday chart has broken above the intraday descending trendline resistance. However, the price candle for the hour has found resistance at the S2 pivot point. However, if the S2 pivot does not resist the price movement, the price action for the day is expected to continue rising on the back of previously noticed increase in buying volumes. Intraday sentiment on NEM is therefore bullish, with the next possible major intraday resistance being seen at 9.6 cents (S1 pivot).
Outlook for XEM/USD
- Mid-term: neutral
- Short term: bullish
NEO/USD
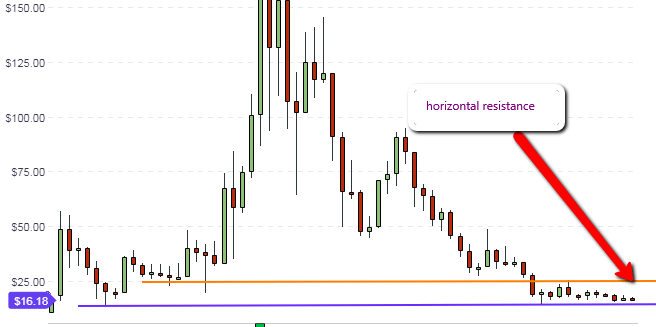
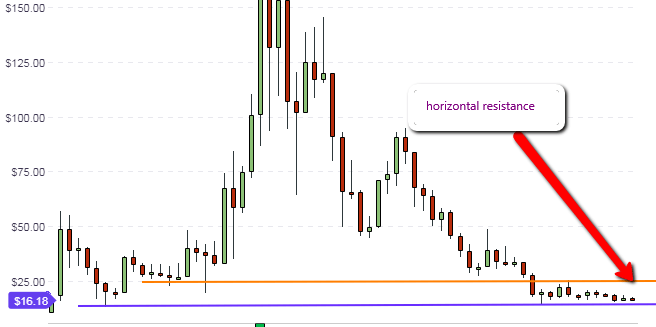
The weekly chart for NEO/USD shows that the horizontal support and resistance trendlines, which define the range for long-term price action, continue to remain valid. Traders who have a long term bullish outlook for NEO should wait for prices to dip towards the support level and test this level without violation, before acquiring this token.
Even though the daily candle for NEO is presently showing some gains for the day, price action is in the middle of the trendlines that individually connect the highs and lows of price action. Therefore, it is expected that price action has to attain one of these trendlines, to properly define where it is headed in the medium-term. If it heads south, it is expected to bounce off the support trendline and to make another push upwards to find resistance at the descending trendline. If it heads upwards, the descending trendline should provide resistance and open the door for another push to the south.
Price movements and trading volume is too thin to support intraday positions, therefore focus of traders should ideally be on the daily chart, and what the price candles do at the identified support/resistance lines.
Outlook for NEO/USD
- Long-term: neutral
- Medium-term: neutral


