Bitcoin, Ethereum and Tronix Heading Lower in Midweek trading Market Analysis Sep. 25
Sep 25, 2018, 2:34pm


Bitcoin, Ethereum and other top cryptos begin the week lower, as bulls struggle to find heir feet in the crypto markets.
Bitcoin and other cryptos have had a weak start to the week, losing ground on Monday and early Tuesday trading. This leaves the cryptos still struggling to attain the highs of previous months, and clearly struggling to hit the resistance levels that have been earlier identified.
So what can we expect heading towards the middle of the week?
BTC/USD
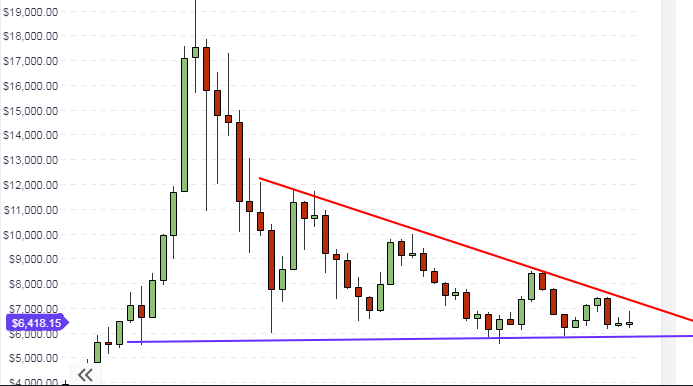
The BTC/USD long-term chart shows that prices have retreated from the week’s open. Bitcoin is presently trading at slightly less than $6,400 on the back of continued bearish sentiment and reluctance of the bulls to go all out to push prices higher. It must be noted that price action within the descending triangle seen on the long-term chart is gradually inching towards the apex, by which time something will have to happen. Either prices will be pushed up by positive news in the market (such as approval of a Bitcoin ETF), or they will be forced down by technical plays, as buyers are getting out of any rallies at progressively lower prices.
The daily chart shows that the price action has aborted its push towards the resistance line, and is now heading downwards. Price is still contained within the resistance and support lines displayed on the charts. It is very likely that if the downward price move continues into the tail end of the week, we may see a bounce off the support line. At the moment, it is difficult to predict what will happen to prices as market players remain undecided.
![]()
For intraday traders, the focus for trading continues to be on the pivot points. The price of BTC/USD is presently bouncing off the S3 support pivot. Therefore, we are likely to see price action trading between the S3 and S2 pivots.
![]()
Further downside may see the S3 pivot broken. However, it is expected that price will stay within the pivot points identified above, providing range trading opportunities for the day traders.
Outlook for BTC/USD
- Long-term: bearish
- Medium-term: neutral to bearish
- Short-term: neutral
ETH/USD
ETH/USD has continued to dither and has found itself unable to push much higher than it ended last week. This may also not be unconnected with the recent competition that the TRON Mainnet is beginning to show with the Ethereum network. Indeed, TRON CEO Justin Sun has asked developers of decentralized apps to start migrating to the TRON network, citing the increased speed of the TRON network as a major advantage. However, ETH continues to remain a crypto of choice for ICO startups. But with fewer ICOs being launched in 2018 than in previous years, and with continued selling of bonus tokens and conversion of ETH derived from such sales to fiat currencies, prices of ETH continue to struggle to attain the next resistance level located at $290.
The price moves on the daily chart show that ETH has started the week lower, having been rejected at the upper trendline of the downward channel that has been seen on the daily chart. However, a smaller upside channel has also formed. These channels continue to remain relevant in the medium term price analysis of ETH. It is expected that ETH prices may bounce off the lower trendline of the minor upward channel.
![]()
On the intraday charts, we see that the pivot points continue to remain the relevant reference points for price movements for the day. Prices have bounced off the S3 support line, and this area is seen to be a previous support that was formed about three weeks ago.
![]()
Price action is therefore expected to trade between the S3 and S2 support level for the day. Intraday traders should watch the behavior of the candles at the pivot points to get guidance on possible range trading between these pivot points.
TRX/USD
The long-term chart for TRX/USD shows that the pair has broken out of the long-term falling wedge seen on the weekly chart. The current weekly candle is presently trading lower, which conforms to the expectation that the price action may attempt a pullback to the broken trendline, where it is expected that the upper trendline of the falling wedge will provide support for continued upside.
The daily chart shows a clearly defined horizontal range, with prices now trending towards the support line on the chart. Price action is expected to bounce off the support level and will continue to trade within the identified ranges.
Outlook for TRX/USD
- Long-term: neutral
- Mid-term: neutral
- Short-term: neutral


