Bitcoin in a Coma as Stellar Lumens and Neo Shine Brightly, Market Analysis Oct. 18
Oct 18, 2018, 3:40pm
Bitcoin seems to have been knocked into a state of induced coma, but Stellar Lumens and NEO make some good upside progress.
As Bitcoin continues its long slumber with virtually no price change between Tuesday and today, we look to see if things will change in the market for the number one crypto as we head into the weekend. Stellar Lumens and Neo, on the other hand, have actually posted gains for the week. So let us examine how these three cryptos will be traded heading into the weekend.
BTC/USD
This week’s price action has been very disappointing, as prices have hardly moved anywhere since our last analysis on Tuesday. It would seem as if Bitcoin has been placed in an induced coma. We can see from the daily chart below that all we have had are a series of doji candles, which signal indecision and a lack of commitment from traders on both sides of the divide.
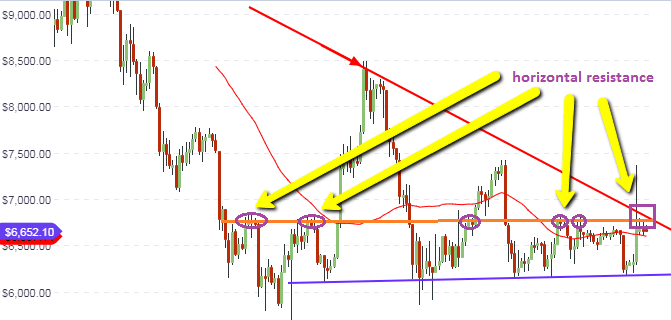
A further look at the daily chart may provide a clue as to why we have such indecision. Prices are dangerously close to the long-term resistance line (red, descending trendline), and price is also at a key medium-term horizontal resistance at $6,650. Buyers will be hard pressed challenging these resistance points which have so far in 2018, proven to be virtually unbreakable. At the same time, sellers may be waiting for a little bit of an upside push before selling off hard as has been the case for several months.
With such bizarrely low volumes and hardly any price movement, intraday traders have absolutely nothing to look forward to. Any intraday trades placed at this point will not work out. Patience is therefore required and it may even be best to turn attention away from the sleeping giant and focus on other better performing cryptos.
Outlook for BTC/USD
- Long-term: neutral
- Medium-term: neutral
- Short-term: neutral
NEO/USD
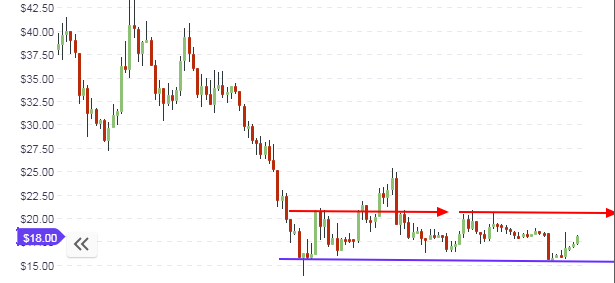
The NEO/USD crypto pair has started to see some upside movement, after trading off the long-term support on the weekly chart. A look at the daily chart below will show that the price of NEO is found in between an identified range, with a floor at $16 and a ceiling at $21. This ceiling is formed by previous price highs which form a resistance that has been tested severely. This resistance area is expected to be tested in subsequent days, as there is plenty of room to the upside for price action to go.
A look at the hourly charts which depict the intraday picture reveals that previous price action for the week formed lows and highs that can be connected with trendlines to form an ascending channel. The channel support line crosses the central pivot at the $17.04 price level. Intraday price action has already breached the upper channel line resistance, which also intersects the R1 pivot.
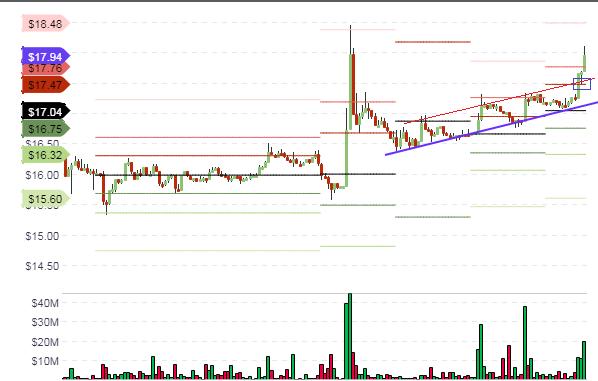
This broken channel line, which intersects the R1 pivot, will therefore form a good basis for pullback long trade re-entries. With few opportunities for intraday trading on many other cryptocurrencies, this setup on the NEO/USD will provide a welcome relief for day traders. Therefore, the way to go for day traders is to look for sound areas that support re-entry trades for short-term buys, which can be seen at the R1 pivot area.
Outlook for NEO/USD
- Long-term: neutral
- Mid-term: neutral
- Short-term: bullish
XLM/USD
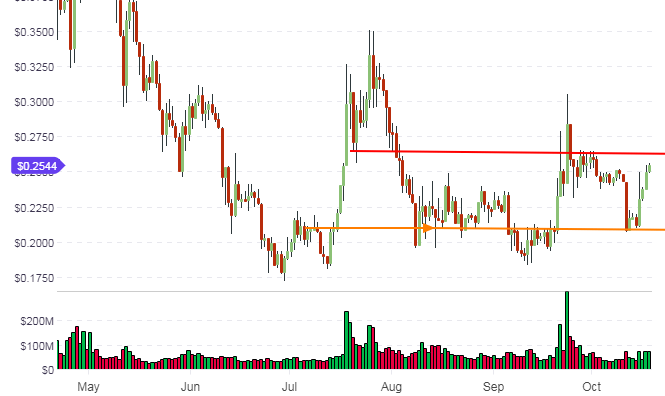
Stellar Lumens has also refused to be put down by the Bitcoin-induced coma, and has posted some appreciable gains for the week. This can be visualized by the active candle, which bounced nicely off the long-term support levels.
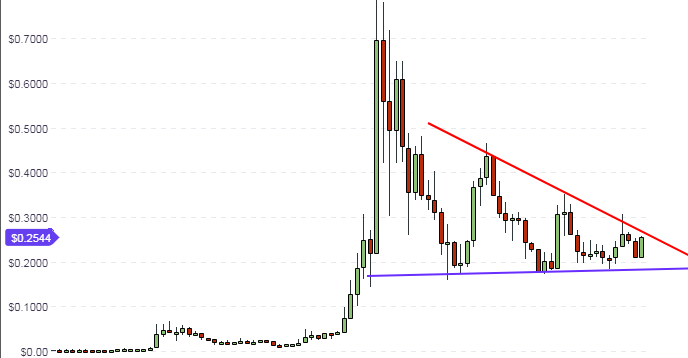
The daily chart shows that the price action is very close to hitting the medium term horizontal resistance, with very little room to the upside before this area is tested. If the price is resisted at this point without being able to break to the upside, price action is likely to remain range-bound heading into next week. A successful break would open the door for price action to climb towards the 30 cents mark.
Intraday price action has a potential for a retracement and a bounce off the central pivot point at the $0.246 price area. The ascending support line shown on the chart will also provide additional support for this move. Therefore, intraday trades will have a good chance for success if they are taken off the bounce of these areas.
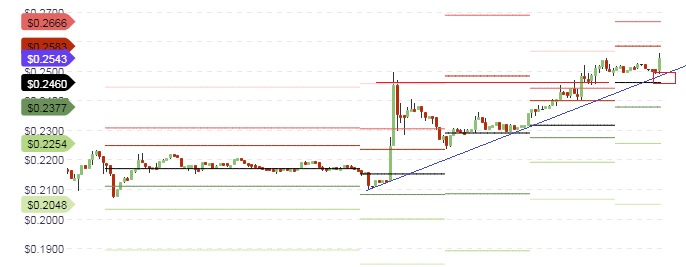
The R1 pivot resistance at 25 cents is also very close to the medium-term resistance shown on the daily chart. This will provide a good exit point for any successful buy trades off the central pivot support.
Outlook for XLM/USD
- Long-term: neutral
- Medium-term: neutral
- Short-term: bullish


