
BTC Awakes from Slumber, But Not in the Way that HODLers Would Have Expected
Oct 30, 2018, 12:26PMBTC is out of its 2-week coma, but continues to disappoint HODLers as it drags down several cryptocurrencies down with it.
Bitcoin has finally come back to life, although not in a way many HODLers would have wanted. A general sell-off yesterday afternoon caused the major cryptos to shed some weight, with Bitcoin leading the way in a $150 short move. Although off its yesterday lows, Bitcoin prices have begun to show some increased activity, which should engender some trading positions.
The sell-off also triggered price movements in several other cryptos such as BCH, LTC, XRP, XEM, etc. Today’s analysis takes a look at what happened and what traders should look out for on the charts going forward.
BTC/USD
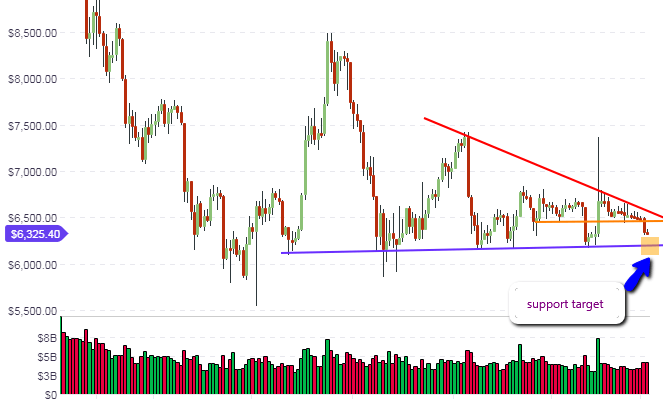
After nearly three weeks of doing practically nothing but sit on the $6,480 price level, selling activity picked up on the BTC/USD pair as prices were forced down by nearly $150 to trade just above the $6,300 price level. In the context of the long-term outlook for the BTC/USD pair, price movements are still contained within the long term support and resistance levels seen between $5,800 and $7,200. Therefore, the long-term outlook for the no.1 crypto remains unchanged.
Much of the price movements to be witnessed in BTC will stem from the medium-term and short-term price activity. The daily chart shows that the support line that had held up price action since the Tether-induced spike of a few weeks ago has been broken by yesterday’s downside movement. However, price action has still not attained the medium term support line. Therefore, a medium term price target of $6,000 to $6,150 is still on the cards. Sentiment in the market is still bearish and it is expected that sellers would make another push towards this support area as we enter into the first week of November. To the upside, the $6,480 support-turned resistance will remain relevant, and any bounces from the lows of the current price action will have to breach this area for more upside to be seen.
The intraday picture shows that trading volumes have thinned out after yesterday’s move, but this may be a period of rest before the bearish market sentiment resumes.
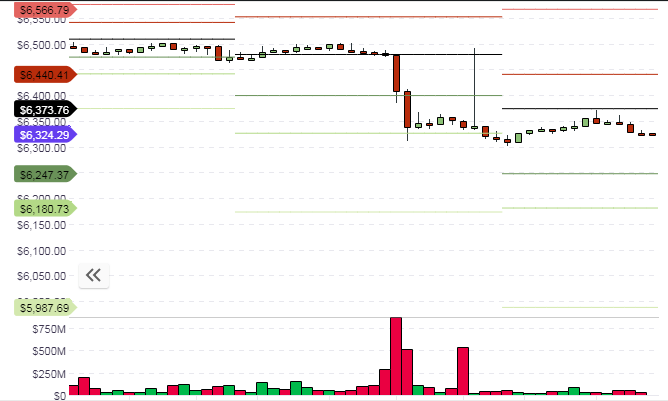
The central pivot price level of $6,373 will remain today’s resistance area to beat. It has already been tested once without being broken. A subsequent test of this price area without an upside break may see sellers deciding to take more positions at that area in order to target the S1 support price level of $6,247. In the absence of strong buying pressure, further downside for BTC cannot be ruled out.
Outlook for BTC/USD
- Long term: neutral
- Medium term: bearish
- Short term: bearish
XEM/USD
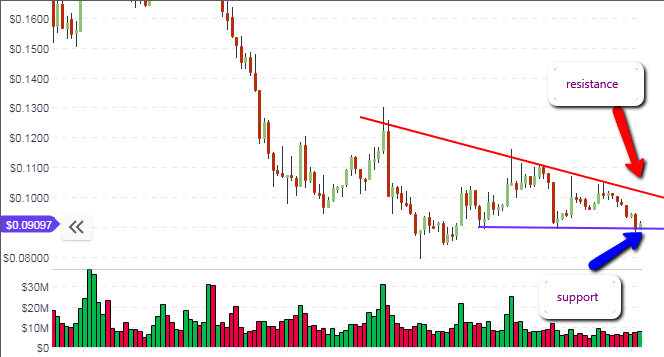
NEM was not much affected by yesterday’s bearish market sentiment, leaving the medium-term outlook intact. The daily chart shows that prices have bounced from the trendline support within the context of price movements that have formed a symmetrical triangle. This price move is therefore still working according to expectation, which is that prices will continue to trade within the boundaries of the triangle until a breakout occurs.
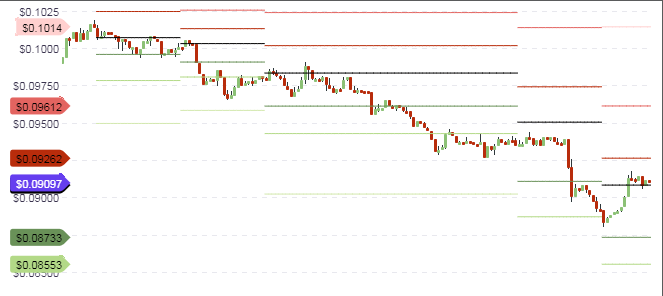
The intraday price candles have been able to push prices above the central pivot point at 90 cents. This will provide an impetus for bullish price movements if the expected downside tests of the broken central pivot fail to violate it. Considering the bullish bounce seen on the daily chart, the expectation is for prices to end the day higher than they started it. The central pivot may therefore support bullish trades for the day, if there is no selling pressure to counteract current price action.
Outlook for XEM/USD
- Mid-term: neutral
- Short term: bullish
XRP/USD
Five weeks ago, XRP/USD experienced a bullish breakout from the falling wedge pattern that formed from several months of price action. Prices have since retreated from the 75 cents high achieved by the weekly breakout candle. Yesterday’s drop in BTC prices also weighed on XRP, bring it into firm contact with the red support line at the 43 cents mark. This level is going to be tested by this week’s candle severally and it remains to be seen if this price level will hold.
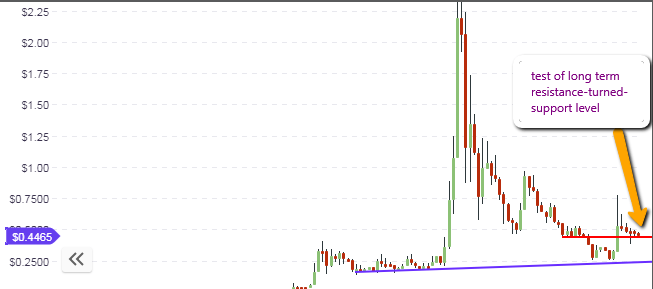
The daily chart shows the picture on the long-term weekly chart more clearly. Yesterday’s bearish price candle bounced nicely off the 43 cents support line, with today’s candle starting off on a bullish note. A price range has therefore been formed, consisting of the 43 cents new support line formed by yesterday’s candle low and the 46 cents resistance line which is the previous support that was broken by yesterday’s price action. It must also be stated that the 43 cents support area is a price level that was previously tested a few months ago and held firmly (points 1, 2, 3 and 4).
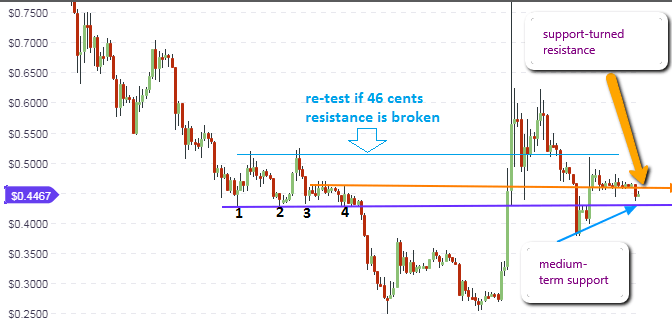
The expectation is for price action to trade within this range if the price candles/bars do not violate these support/resistance areas defined by the lines at 43 cents and 46 cents. Traders with a medium-term focus should therefore keep their focus on these price levels to see if they would hold or not. A breach of the 46 cents resistance will open the door for a retest of the 52 cents price area.
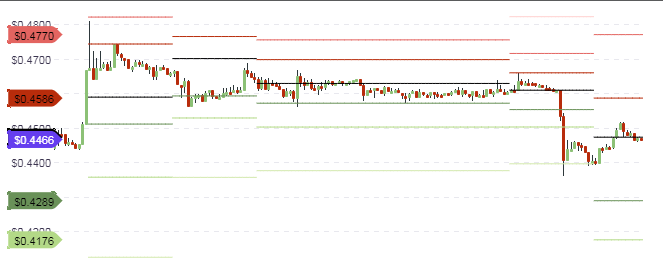
Intraday trades would focus on the central pivot which is currently resisting upside price action. Failure to break the central pivot would open the door for possible price move to the south, where the intraday support price of 44 cents would be tested. If the central pivot is broken to the upside, then a push to the 46 cents price level (R1 pivot) would be on the cards.
Outlook for XRP/USD
- Long term: neutral
- Medium term: neutral
- Short term: neutral
Disclaimer: information contained herein is provided without considering your personal circumstances, therefore should not be construed as financial advice, investment recommendation or an offer of, or solicitation for, any transactions in cryptocurrencies.


