Where Some See Bleak Charts Others See Opportunity: Trade Paths Aug. 1
Aug 14, 2018, 2:43pm
The top cryptocurrencies suffered from yet another selloff in late Monday trading. What does the rest of the week hold for the top cryptos?
Following a very brief rally on Sunday August 14, cryptocurrencies took another massive hit in late Monday trading, with Bitcoin leading the way. Ethereum is now pushing towards support areas not seen in over a year, and Bitcoin Cash is doing the same.
As we head into the midweek, what does the price action hold for traders interested in trading the top cryptocurrencies?
BTC/USD
BTC/USD has approached the $5,900 level, which is very close to the support area of $5,700 that was seen in June 2018. At that time, we saw a massive entry by the bulls, who saw that price level as a cheap area at which to assume long positions on the number 1 cryptocurrency. The picture on the weekly chart as far as the key levels of support and resistance remains unchanged, with the price once more pushing towards the horizontal support price of $5,700.
Given the fact that this support area has held firm on previous tests within the last one year, this area is expected to hold firm once more if there is no closing penetration of the support line. Therefore, long-term traders who are bullish on BTC should see this support line as a good place with which to assume long entries, pending the behavior of this candle at the end of the current week.
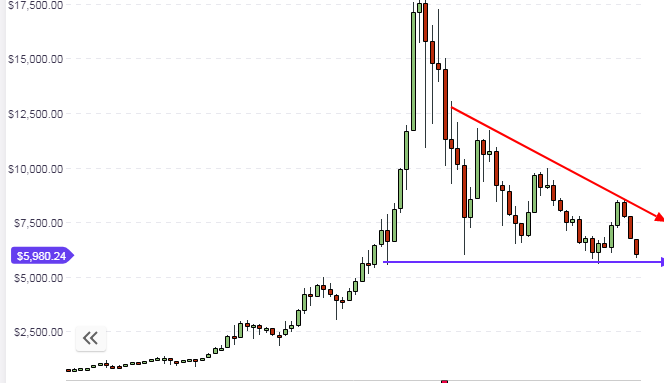
Things are not much different on the daily chart, which is also seeing Bitcoin prices very close to the previous medium-term support area as well. We therefore move to the hourly chart to see what intraday opportunities present themselves for trading.
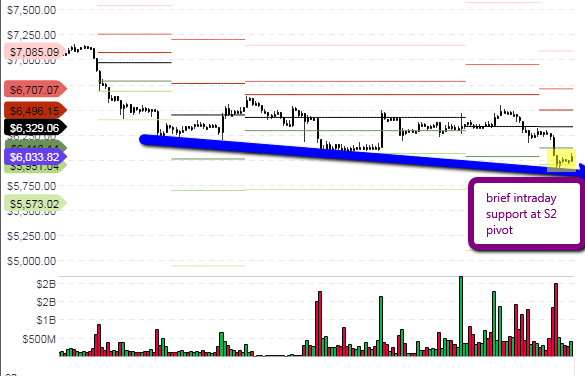
The hourly chart reveals that price action has found a short-term support at the S2 pivot. Short term, the pivot points continue to provide some direction as to what trades should be taken, but these must be done using the direction of the prevailing trend. Even though the trend is generally bearish long-term and medium-term, we should see some support at the S2 or S3 levels intraday.
Bear in mind that there is still some room for further downside on the daily and weekly charts before prices hit the $5,700 June 2018 support. Therefore, traders should ideally be ready for a little more downside towards the S3 pivot, so as to make allowance for a little more downside to price action. If the S3 support is not broken, then this may be a better area to take a bounce trade.
Outlook for BTC/USD
- Long-term: bearish
- Medium-term: bearish
- Short-term: bullish
ETH/USD
Ethereum has taken a battering this week, with prices taking out the $358 support level and now at the point of violating the next major support at $290. However, the weekly candle is yet to close, so it is presently unknown if prices will close below this support or go back above it.
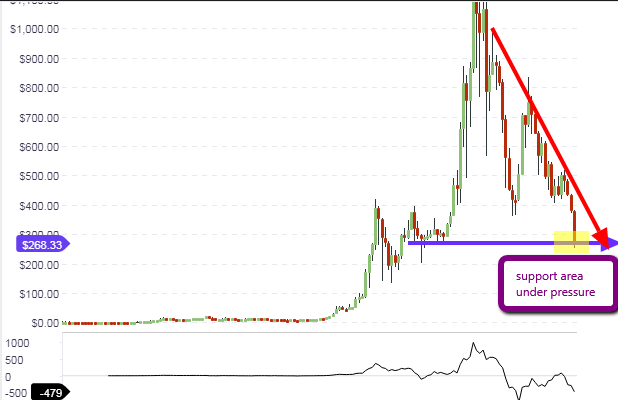
The momentum indicator seems to show that there is yet more downside to this pair. However, the end of the week will give a clearer long-term picture as to the direction of the ETH/USD pair heading into next week. The long-term view is still decidedly bearish.
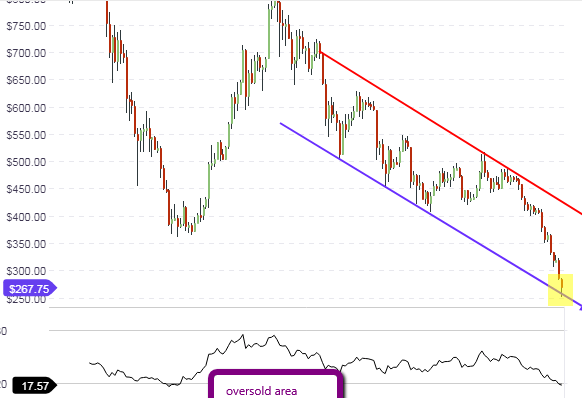
The daily chart which provides the medium-term outlook for the ETH/USD pair shows a number of important things. First, price seems to be confined now within the boundaries of a downward channel, and price seems to have stalled at the lower channel trendline. This is in keeping with the picture on the weekly chart, where price action is now at the $268 support level. We also see the Relative Strength Index line heading into the oversold area. This is by no means a signal to buy, as we would need the RSI to display the failure swing behavior for any upward reversal to occur.
It is advised therefore to watch the behavior of the daily candle at the lower channel line. If the candle/bar closes above this line, this could be a signal for a short-term rally towards the opposing channel line. However, the medium term mood is still bearish.
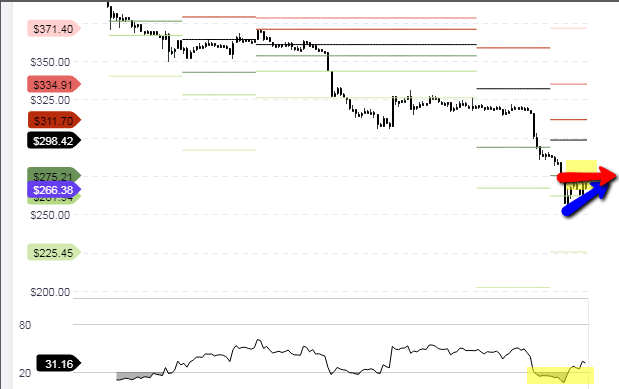
The hourly chart shows that price action has taken a bounce off the S3 pivot support and is presently oscillating between the S2 and S3 pivots. It is likely that the price action may be bound within this range for some time before it either breaks above the S2 pivot or breaks down below the S3 pivot. Traders should watch the behavior of the candlesticks at these pivots, and compare this with the long and medium-term outlook before taking any trades.
Outlook for ETH/USD
- Long-Term – bearish
- Mid-term – bearish
- Short-term – bullish
BCH/USD
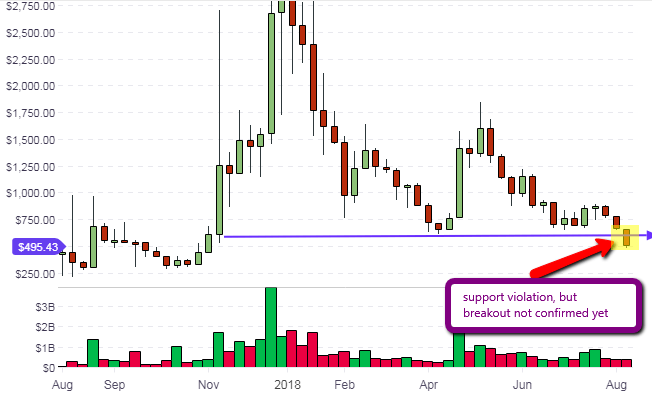
The long-term support that was identified on the weekly chart for Bitcoin Cash has been violated. However, the weekly candle has not closed, so the true picture of whether a break of the long-term support has occurred or not is still not clear. However, the cryptocurrency pair has suffered severe losses in the last one week as a result of the bearish sentiment prevalent in the cryptocurrency market. This bearishness may yet persist, at least until the end of the week when the position of the weekly bar can be determined.
Stepping down to the hourly chart, we see that the downward price action has stalled at the S2 pivot, and price is oscillating between the S2 pivot and S1 above it. The picture at this time looks like that of a bearish flag. So it is possible that we may see prices locked in within the range of the flag until a resumption of the downward price movement occurs.
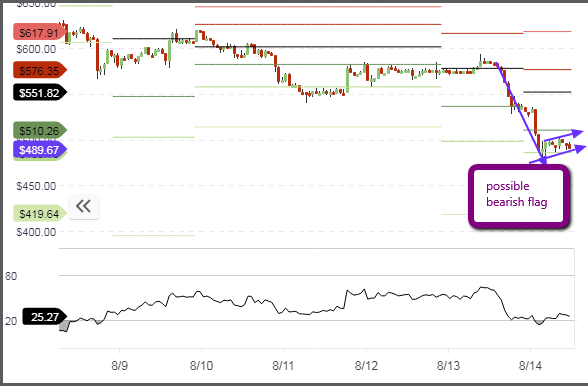
This trade will be dependent on what happens on the weekly chart. If the weekly bar/candle ends up closing below the support line at $510, then this will open the door for the downside break of the evolving bearish flag on the short term chart. So day traders are advised to use the situation on the weekly chart as a guide to the direction of their short-term trades.
Outlook for BCH/USD
- Long-term: bearish
- Medium-term: bearish
- Short-term: potentially bearish
LTC/USD
Litecoin has taken out the previous support in its pairing with the USD at $78 and is now butting against the next major long term support at $51.26. So far, this support has held well, even though it has been tested several times within the last 10 days.
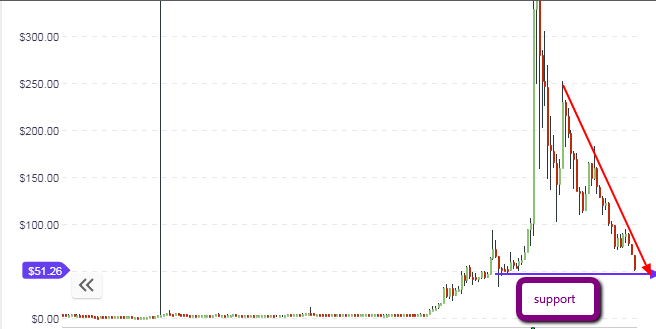
The daily chart shows that the asset is still in a free fall and the RSI is heading towards the oversold region. This seems to show that there is still some downside movement left in this pair.
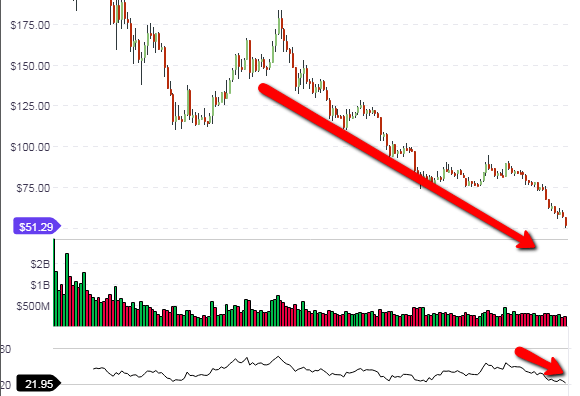
This downside may however not have much left in it if the RSI hits the oversold region. You should also remember that there is a long-term support level at current prices to contend with.
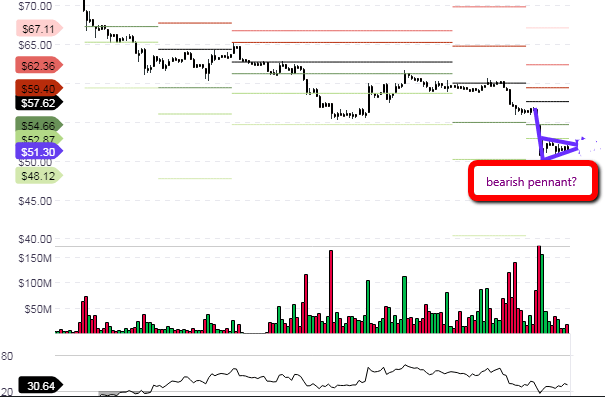
Day traders can see the formation of what looks like a bearish pennant on the hourly chart, even as prices have found some support at the S2 pivot. However, the medium term charts suggest that some downside movement is possible. Therefore, we will probably see the break of price below the evolving bearish pennant, as far as trading in the short term is concerned.
If by the end of the week, the weekly candle closes above the support, then any short-term downside movements are likely to be limited and we should be gearing up for a brief rally.


