Bitcoin, Ethereum Face Uphill Tasks With Respect to Price Action
Oct 04, 2018, 3:51pm
Uphill tasks for Bitcoin as bulls struggle to find momentum to exert market influence, Ripple experiences disappointment.
The cryptocurrency market ended the trading day on Wednesday sharply down but has since staged a recovery to the highs seen at the commencement of the new month. Bitcoin led the losers on Wednesday but has also led the gains seen on Thursday morning’s trading session, gaining about $110. Particularly worrying to bullish-minded investors is the difficulty that Bitcoin and other top cryptocurrencies have had in even attaining the expected resistance areas seen on the long-term charts. Bitcoin especially has had great trouble sustaining any upside movement beyond $6,600. This is usually indicative of a weakening of the bulls and the strength of the bears in not allowing any price gains beyond this point.
BTC/USD
BTC lost close to $250 in Wednesday trading, dropping to as low as $6,350. However, some quick bargain hunting at the lower end of the trading range of the last three weeks saw prices bouncing off this level to just below the $6,550 mark. However, this price level continues to remain in no man’s land as far as the long-term chart is concerned. It is hard at this point to know if price action will be able to break the tight trading range of the last three weeks to at least get to the resistance line that may be found at the $6,900 – $7,000 price level. If the price action continues to experience hardship in breaching the $6,600 level to the upside, we may see some strong aggressive selling that will drive prices way down to the support levels seen on the charts.
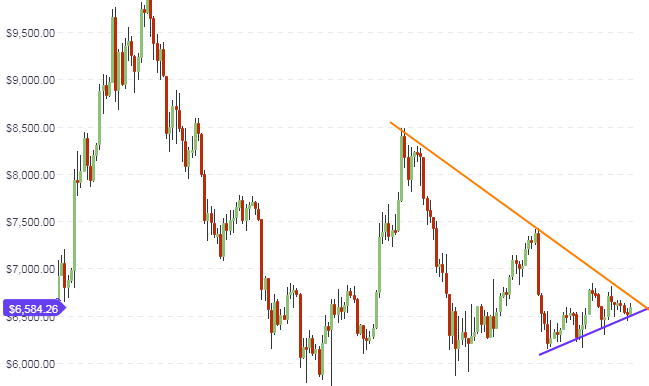
With very little change in the long-term outlook for BTC/USD, the daily chart will be the main focus of today’s analysis. We continue to see price action limited to the downside by the blue ascending trendline, and to the upside by the orange descending trendline. These lines form a symmetrical triangle. We are getting close to the apex of this triangle. We could see a huge price breakout as early as next week. At the moment, the bias for such a move is to the downside, and if this occurs, we could see a move all the way down to the $5,800 mark before price will find support. Any chance for an upside breakout will have to depend on very strong market news; it is hard at this time to see where that is coming from.
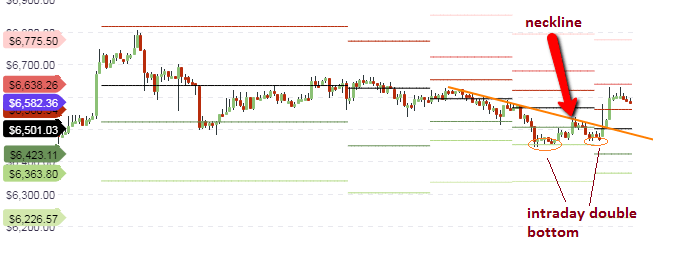
A look at the hourly chart shows the presence of an intraday double bottom. This was occasioned by the downside price moves and recovery that happened on Monday and Wednesday. The intraday sloping resistance levels of the week provided the neckline for this pattern, and we saw the upside break of this trendline push this pattern to resolution in Thursday’s early hour trading. Price is retreating to the R1 price pivot. Whether this pivot will hold or not will be seen in today’s trading. If it is broken to the downside, then we will see price action trading down to the central pivot at $6,500.
Price action on the intraday charts is locked in a very tight range, with prices finding support at the central pivot. If there is no improvement in the trading volumes for the day, we expect that price will trade within the range provided by the central pivot below, and the S1 pivot above. There is only a $60 price gap between these two pivots, which by Bitcoin’s lofty standards, is not enough distance to support intraday trades.
Outlook for BTC/USD
- Long-term: neutral
- Medium-term: neutral to bearish
- Short-term: bearish
BCH/USD
Bitcoin Cash continues to find itself trading within the support and resistance levels that have been identified in the long-term chart. The focus will therefore shift to the medium term chart (the daily chart), where a number of possibilities are going play out.
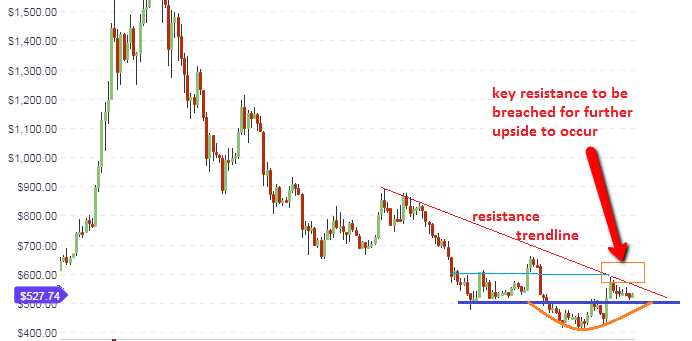
This version of the daily chart shows the descending trendline which continues to serve as a major price resistance. This line is expected to provide resistance at the $530 price area (orange box), which is also the area where price had initially formed a horizontal support (now turned resistance).
To further buttress the significance of the $530 price area as a resistance that has to be overcome for further upside to be seen in the price of Bitcoin Cash, we use the Fibonacci retracement tool to derive the various price retracement levels. These can be seen on the chart below:
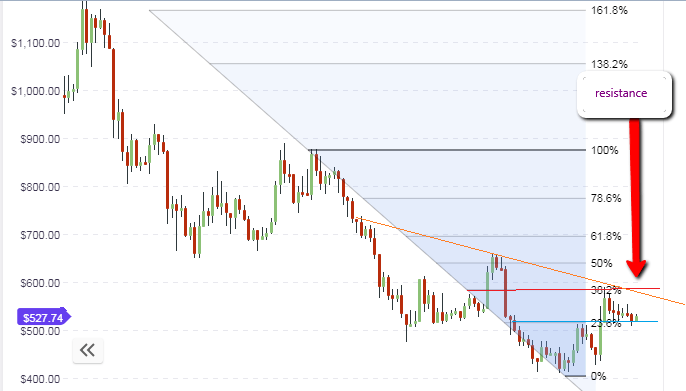
We can see that price action will be limited at the 38.2% Fibonacci retracement level at $590, with this area serving as the major resistance level on the long-term chart. For this price level to be achieved, price action has to break above the $530 price level. The 23.6% Fibonacci retracement price area is providing support for this move, as we can see from the chart.
The trading ranges on the intraday charts are too thin for any meaningful intraday positions. Day traders have to stay on the sidelines and await more favorable price action, or they can switch their trading style to trade around the $530 key level. Upside trades would be contrarian in nature, waiting for a breakout north of $530 with a possible exit at the $590 price resistance. Failure of a break of $530 will see prices heading down south to at least the 23.6% Fibonacci level. It must be stated that if there is a sell-off on Bitcoin, it will drag Bitcoin Cash down with it. Bitcoin Cash traders should keep a careful watch on the BTC/USD daily chart, as a major price move looks imminent.
Outlook for BCH/USD
- Long-term: neutral
- Medium-term: neutral
- Short-term: neutral
XRP/USD
The price action of XRP/USD was expected to respond to a possible major announcement at the Ripple Swell Event that was just concluded in San Francisco on October 1-2. Rather, there was a disappointment which saw the price of Ripple drop below the ascending trendline support that was formed by price action following the upside breakout and eventual pullback.
The daily chart shows that the price action for the last two days is ticking upwards, and is expected to test the ascending support-turned-resistance line. This is at the 55 cents price area (boxed area). The chart also shows that this price level is an area where price found resistance previously.
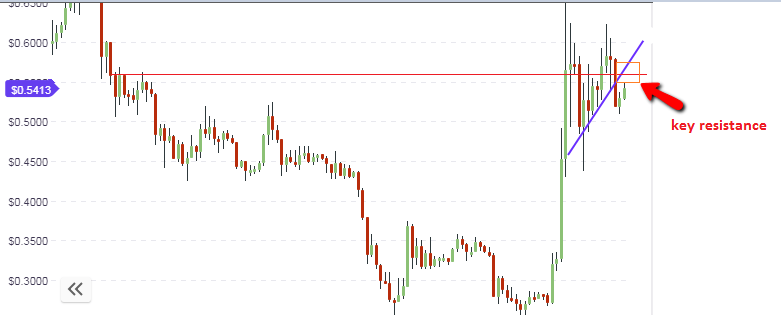
If the 50 cents resistance area is broken to the upside, the price could move upwards to test the next resistance level at 80 cents. Failure of price action to break the 55 cents resistance will see it pushed downwards to the next support level at 50 cents.
The price action on the intraday charts is limited. Therefore, traders should seek direction from the daily chart setup.
Outlook for XRP/USD
- Long-term: neutral
- Mid-term: neutral
- Shorttterm: neutral


