Bitcoin Has Virtually Run Out of Upside Momentum, Could Soon Head South: Oct. 7
Oct 07, 2018, 2:44pm
Bitcoin has a possibility of a bearish breakout of the symmetrical triangle on the daily chart. Ripple and Ethereum may also be bearish.
The weekend has seen very little movement in most of the major cryptocurrencies. Bitcoin, Ethereum and other top cryptos have seen very little upside momentum and are trading in very tight ranges. However, this may be the calm before a major storm of movements in the week ahead. So what is expected of the major cryptocurrency movements this week?
BTC/USD
BTC has continued to remain in a very tight range which has the $6,650 as the ceiling and $6450 as the floor. However, momentum continues to remain bearish, even though the price action on the long-term chart continues to operate within the confines of the horizontal support at $5,800 and the descending resistance which should be found at the $7,000 mark.
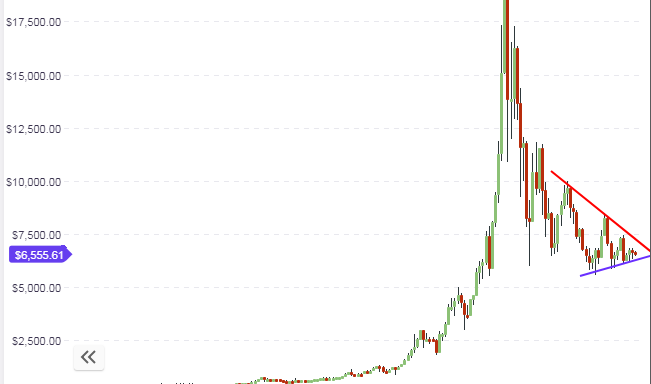
The daily chart will continue to be the main focus for traders, with the trend lines forming a symmetrical triangle. As we approach the apex of this triangle, traders would be looking for a breakout. The trading sentiment is currently bearish, so it is possible that a downside breakout will see a resumption of the price move to the $5,800 horizontal support mark before price will find support. Any chance for an upside breakout will have to depend on very strong market news for Bitcoin, which at the moment is not visible in the horizon.
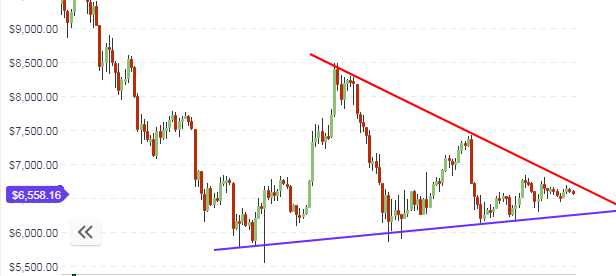
A look at the hourly chart shows price bouncing on the central pivot price of $6,500. This is expected to remain the support line for the day’s price movement.
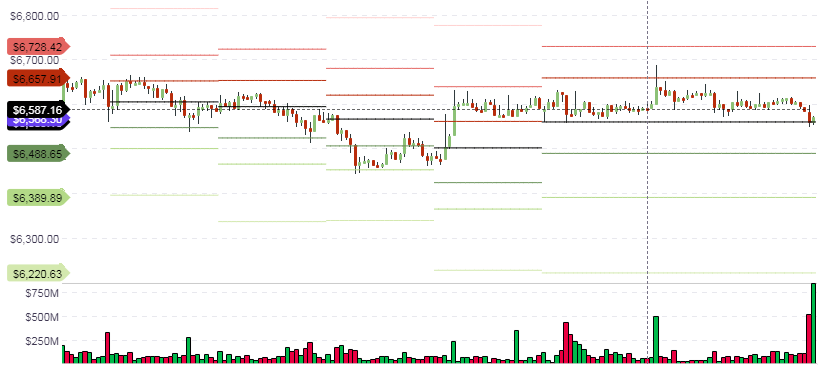
Price action on the intraday charts continues to remain locked in a very tight range. A break of the central pivot is expected to allow a downside push by sellers to the $6,480 mark, which is the S1 pivot line. With very little upside momentum, the break of the central pivot is the intraday price move to watch out for.
Outlook for BTC/USD
- Long-term: neutral to bearish
- Medium-term: bearish
- Short-term: neutral
XRP/USD
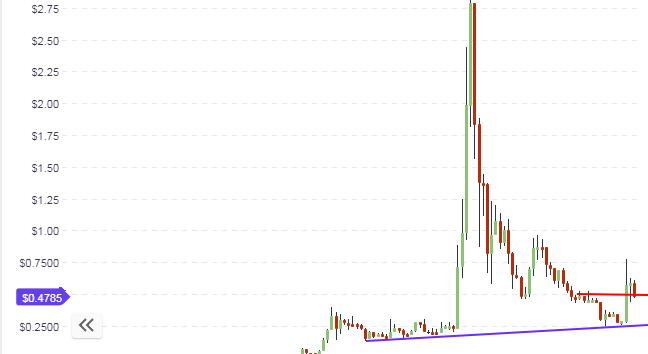
The price action of XRP/USD broke below the ascending trendline support after the Swell Event in San Francisco, and an attempted upside pullback failed miserably. This has opened the door for continued downside movement on the asset, which is now expected to target the horizontal support at the 45 cents mark.
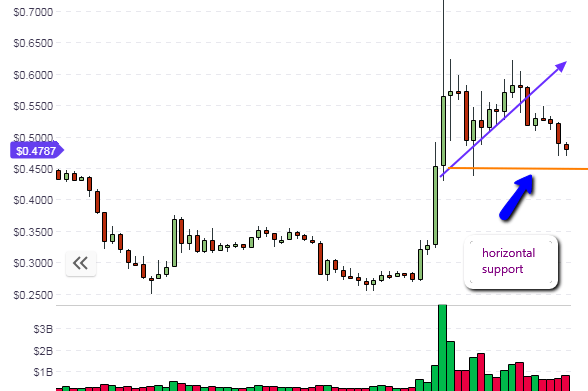
The 45 cents area is a key support level, even on the weekly long-term chart. If price action is able to break this area to the downside, then the door will be open for a push to the 25 cents long-term support. However, this long-term price move will take quite some time to evolve. In between, we expect price to test this area several times and to find support.
So what can intraday traders hope for? There is a divergence playing out presently, with the RSI showing progressively higher lows while the price action is showing progressively lower lows. This provides the basis for a brief upside push to the 50 cents price level in the next 2 days.
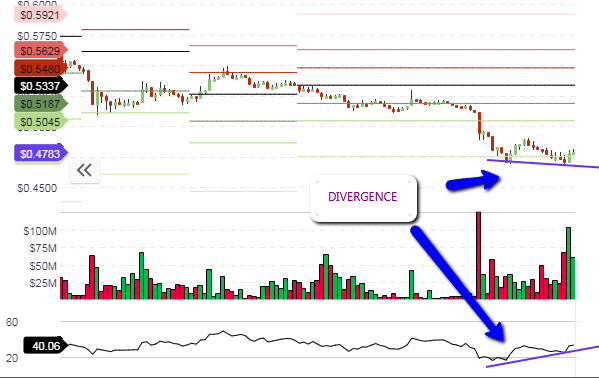
Therefore, intraday traders can take some short bounce trades which will be a short-term resolution of the positive divergence.
Outlook for XRP/USD
- Long-term: neutral
- Mid-term: bearish
- Short-term: bullish
ETH/USD
The outlook for ETH/USD has not changed much from our last analysis. However, price action on the weekly chart is in a precarious place: very close to resistance and also very close to support. We expect price to test the resistance at $290 or to test the support at $190, depending on which way traders want to move. This is because price is presently in no man’s land, and it has to move to either of the two mentioned key levels for further determination of long-term focus for the asset.
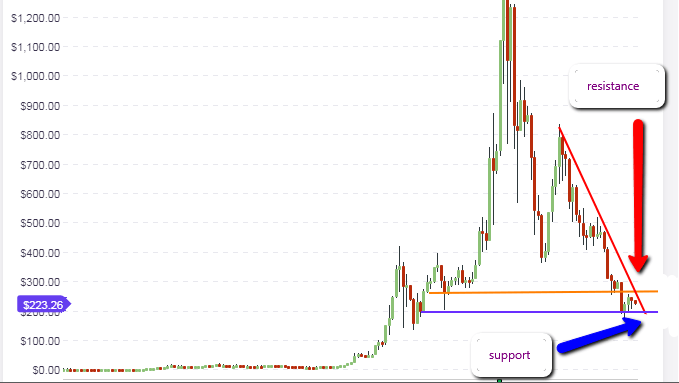
The 23.6% Fibo level on the daily chart is located at the $290 price area, which is expected to continue to remain the resistance price level to beat for any further upsides to take place.
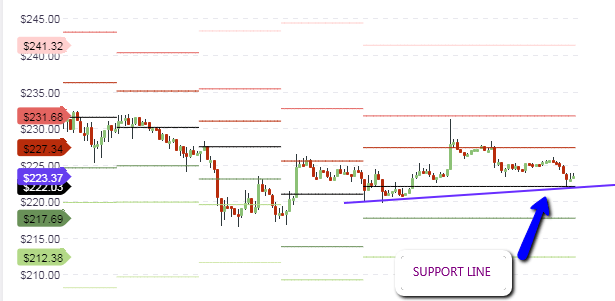
The intraday price chart shows an ascending support line which intersects the central pivot at the $223 price area. What needs to be seen is whether the price action will be able to firmly bounce off this area and start to push towards the R1 pivot at $227. The closeness in price between pivot points shows just how tight the trading ranges are. Intraday traders need to pay attention to the behavior of the candles/bars action around the various pivot point.
Outlook for ETH/USD
- Long-term: neutral
- Medium-term: neutral
- Short-term: neutral


