ETH Picture Starts Clearing Up, BCH Selling Volumes Should Pick Up & More: Aug. 2
Aug 2, 2018, 11:28AMThe top cryptocurrencies have given back most of last week's gains. This trend looks set to continue heading into the 1st weekend of August.
This week saw a selloff in the top cryptocurrencies on the back of market uncertainties. As we head into the first weekend of August 2018, what is the outlook for the 4 of the top cryptocurrencies?
BTC/USD
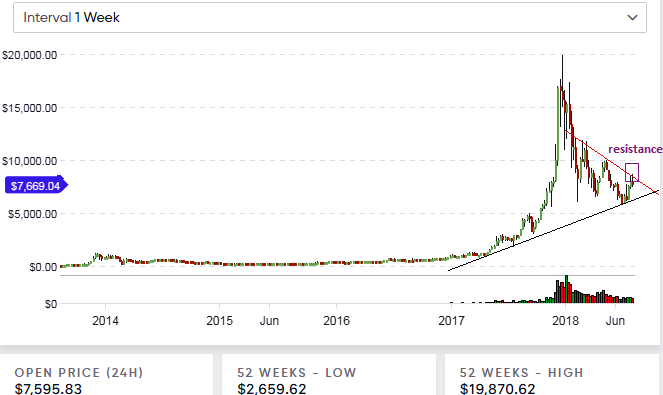
As stated in our analysis for Tuesday, July 31, Bitcoin/USD will in the long term, trade between the boundaries of the symmetrical triangle found on the weekly chart. The selloff we've seen this week was simply the result of “sell on rally” orders that were taken off the upper trendline resistance seen in the symmetrical triangle.
In the medium term, we look at the situation on the daily chart, which reveals that the rising wedge identified in our analysis for last week has performed according to expectation. Of importance is also the fact that the downside breakout breached the resistance area seen at $7,700, which had formed in June 2018. This resistance line, which had indeed turned to a support line after being broken to the upside by the brief July rally, was broken to the downside in Wednesday’s trading.
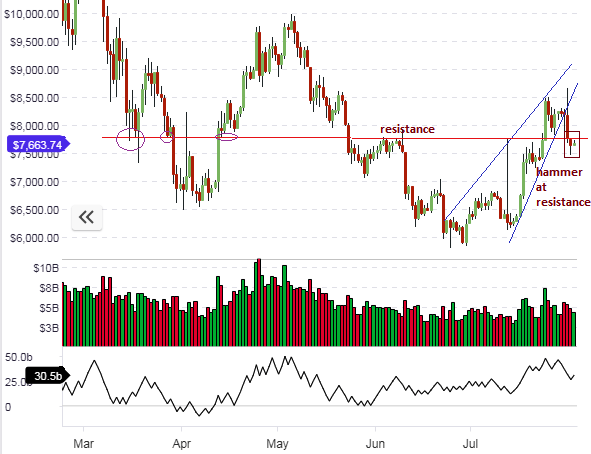
Further attempts at recovery to the upside have been resisted at this key level, with the formation of a pinbar candle (hammer), signaling that we may see further downside from this level.
This picture seems to be confirmed on the hourly chart, which shows that the price of BTC/USD is presently being resisted at the R1 pivot level of $7,672. If this level is tested several times without being broken, then a dip from this level to the daily pivot at $7,581 is likely.
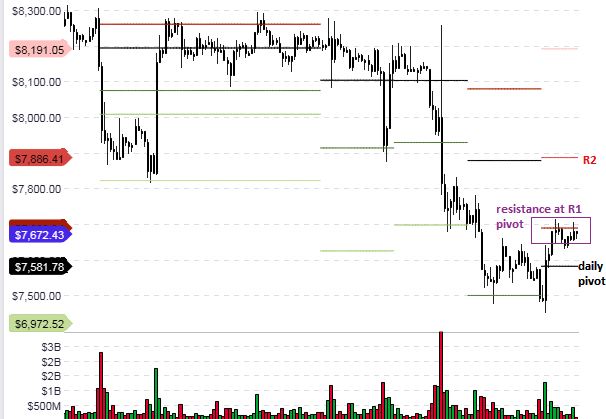
Traders must watch out for the behavior of the price bars/candles at the R1 resistance pivot to see whether to short BTC/USD from this level or not.
ETH/USD
The picture with the ETH/USD pair is beginning to get a bit clearer. The weekly chart reveals that the long term weekly price candle/bar is now firmly pushing against the support trendline in the symmetrical triangle. This is the last stand for this pattern, as price is now firmly at the apex of this triangle. What this means is that the next two weeks will decide whether in the long term, the major support provided by the lower trendline of the symmetrical triangle will finally give way or not.
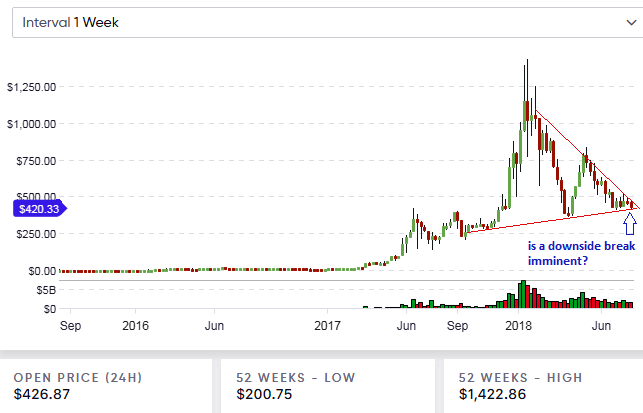
To understand what is happening in the medium term, the daily charts provide some insight.
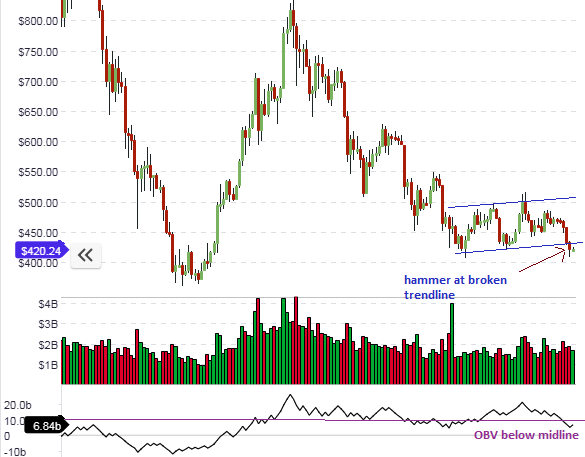
The pair has been trading within the range formed by the upward channel. However, the price action has broken below the lower channel trendline, and the attempted pullback this broken line has resulted in a bearish pinbar formation. The On Balance Volume (OBV) oscillator has also broken below the midline in the indicator window. The medium term outlook is therefore bearish.
But what do the hourly charts say? Day traders will have to focus on the pivot points, as well as the downward channel that has formed in the short term. Price action is presently being resisted at the upper channel trendline on the H1 chart.
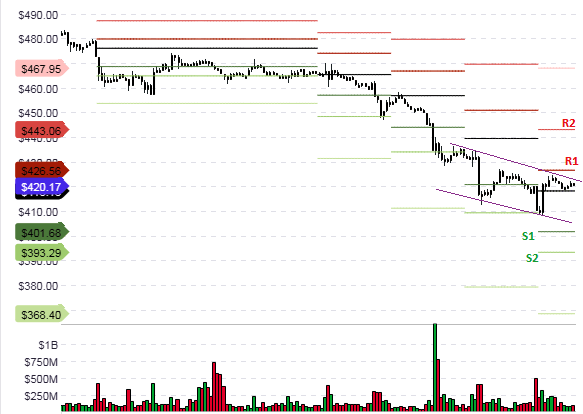
This line coincides with the midpoint between the daily pivot and the R1 pivot (i.e. between $420.17 and $426.56). The outlook is therefore also bearish, and intraday trades should therefore be focusing on shorts off this trendline or at the R1 pivot.
LTC/USD
As identified in the last analysis piece, the general outlook for LTC/USD continues to remain negative. The downside breakout movement from the descending triangle continued in Wednesday’s trading, pushing prices from Tuesday’s price at the time of our last analysis from $79.39 to $77.45.
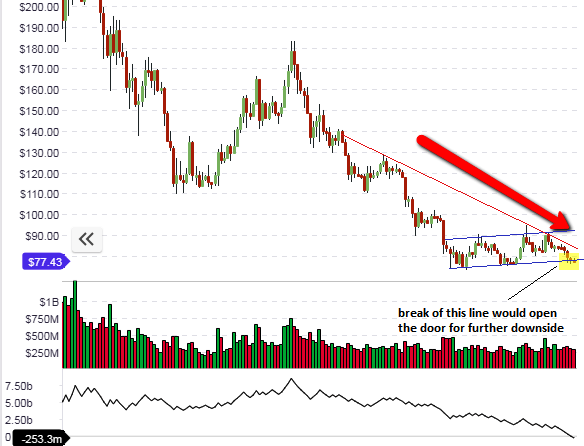
The daily chart shows that in the medium term, the price action has broken the lower channel trendline, but is still looking for double penetration confirmation. If this occurs, then this would potentially open the door to further downside.
On the intraday charts, we see upside being restricted by the descending trendline, which intersects the R1 intraday resistance pivot. This may serve as the limiting factor to any upside moves in the short term.
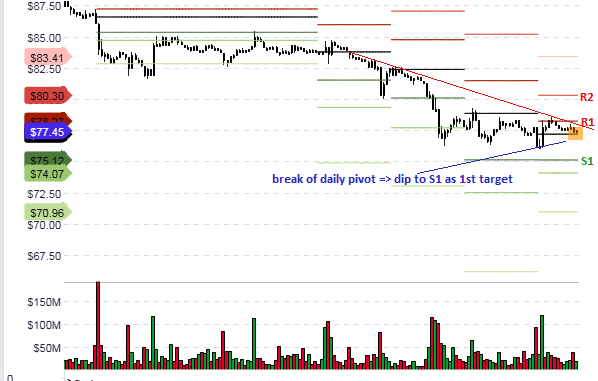
A downside break of the daily pivot will see price attaining the $75.12 mark as the first target for any short trades from that level.
BCH/USD
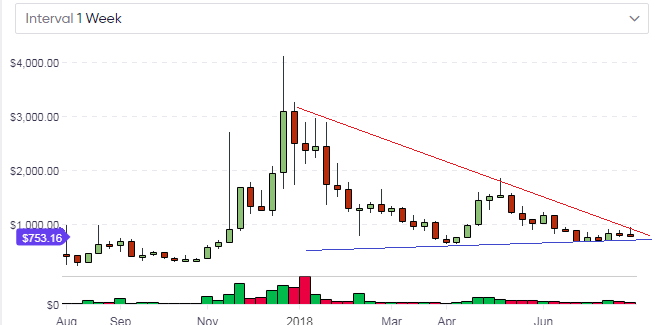
The long term weekly chart of BCH/USD shows that the price action is confined in the symmetrical triangle. The pair will therefore trade within this range in the long term, until a breakout has occurred to pave the way for further directional movement either to the upside or downside.
Medium term, the daily chart reveals that the price action is contained within an upward channel. However, there is a descending trendline resistance which is limiting upside moves. The pair also has the June 2018 horizontal resistance of $908 to contend with. We also see that the oscillator band (the OBV) is limited by a descending trendline, which further confirms the upside limitation.
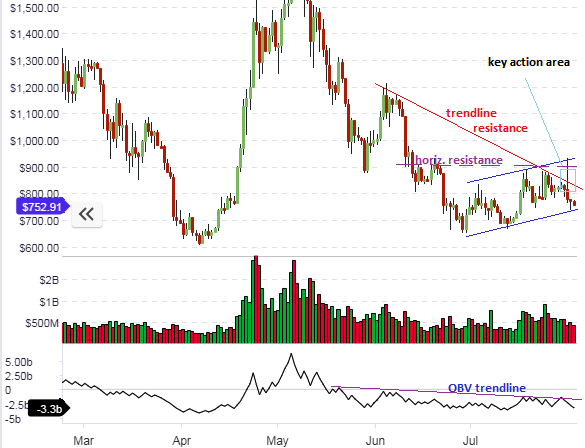
BCH/USD is therefore expected to struggle as far as any upside moves in the medium term are concerned.
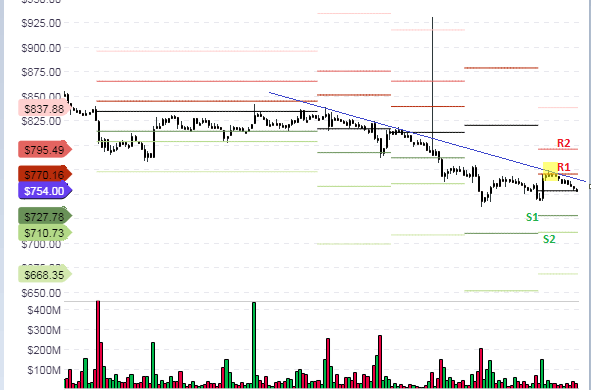
The intraday focus has to be on the price action at the pivot points. The descending trendline (in blue) limits upside, especially at the intersection point at the R1 pivot. This has forced prices all the way to the daily pivot, which has continued to hold on despite the downside pressure. If the daily pivot is broken by a closing penetration to the downside, then expect a further dip to the S1 level as the first target. However, selling volumes need to pick up to make this a reality.
Disclaimer: information contained herein is provided without considering your personal circumstances, therefore should not be construed as financial advice, investment recommendation or an offer of, or solicitation for, any transactions in cryptocurrencies.


