Ethereum Recovers from Previous Losses, Bitcoin Bulls Struggle for Upside Momentum
Sep 16, 2018, 3:16pm
Ethereum prices recover from last week's lows and seem to be heading higher, but Bitcoin needs more impetus to push beyond $6,550.
The cryptocurrency market made some modest gains heading into the weekend, with Bitcoin, Bitcoin Cash, Litecoin and most especially Ethereum making some upside movements. Ethereum was the standout performer of all the cryptocoins, gaining 25% of its weekly low price of $165. However, the weekend has seen the cryptos hit intraday resistance, halting further upside price movements.
So what does the new week hold for the cryptocurrency market?
BTC/USD
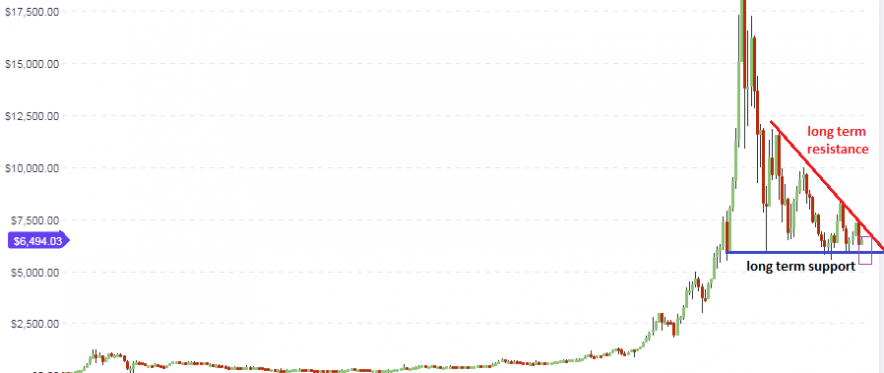
BTC/USD continues to find itself in the long-term price range bordered by the descending trend line and the horizontal support line. Price has decidedly bounced off the support and is midway in the range of prices. It is still expected that the price action should complete its journey to the identified resistance area above. However, bullish progress has been remarkably slow and is expected to remain so as the new week progresses.
The daily chart shows that BTC/USD has found itself unable to break above the daily resistance level of $6550 as can be seen on the daily chart below.
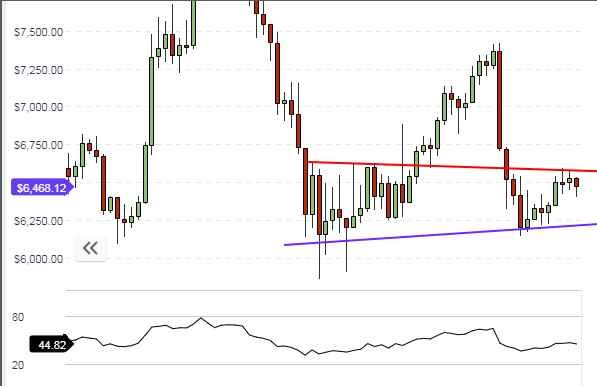
Price action is expected to continue within the identified range found between the red support line, and the blue support line below. Price action will need to break above the $6,550 mark to continue on its upside trajectory if it must attain the long-term resistance line.
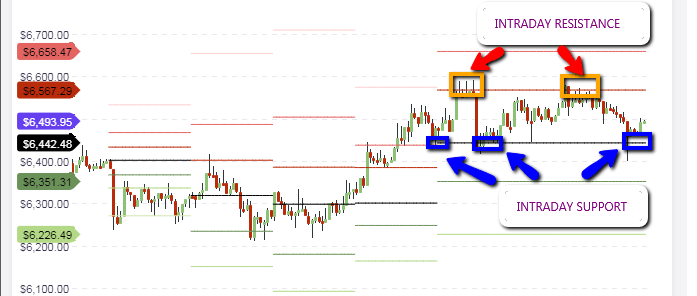
For intraday traders, the focus for trading must be on the pivot points. We see that price action on the hourly chart has an identifiable range: the R1 pivot above, and the central pivot below. Price action for the day will therefore trade within these ranges, but with an upside bias. The R1 intraday resistance is at $6,567. An upside break of this level will see prices pushing towards the R2 pivot at $6,658 at the very least. So day traders should look for areas with which to buy on a price rally, preferably at the central pivot or after the R1 has been broken with a pullback.
Outloook for BTC/USD
- Long-term: bearish
- Medium-term: neutral
- Short-term: bullish
ETH/USD
ETH/USD has been the standout performer heading into the weekend. With the floor threatening to give way midweek when prices tanked all the way to the $165 mark, the price has made a remarkable recovery and is now trading at the $218 mark. This recovery is expected to continue until the $290 mark, which is the nearest long-term resistance.
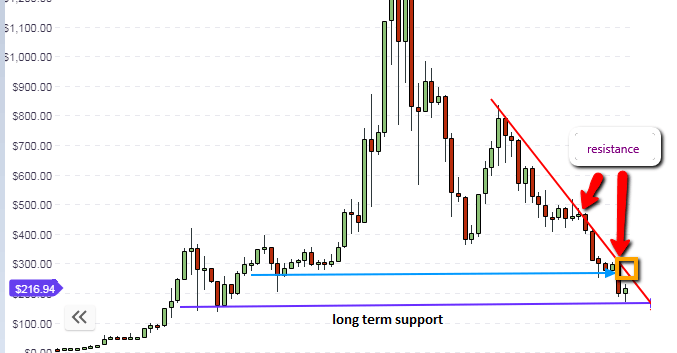
The daily chart shows that the downward channel is still intact, with price having bounced off the lower channel line with a pinbar candle). The upward price recovery has indeed reflected the correction of the divergence situation that was seen on the charts last week. Price action still has some upside to go, and it is expected that the medium term resistance will be seen at the $290.
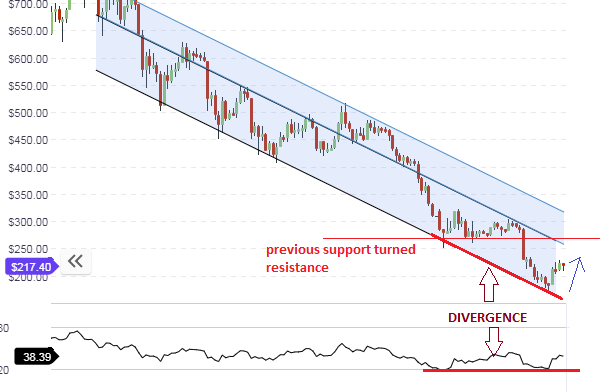
This is an area where previous support on the daily chart was broken. The line drawn at this area will also intersect the middle channel line on the chart, which will reinforce this area as the resistance.
The hourly chart reveals that the price action for the day is being supported by a rising support line, which is causing prices to push hard against the R1 pivot located at the $218 mark. Intraday traders should wait for prices to break above the R1 pivot, and initiate any long trades on a pullback to the R1 pivot if it is broken.

Price movements for the day are expected to stay within the boundaries formed by the rising support line, the R1 or R2 pivot points. Therefore, traders should watch the behaviors of the candles at the identified pivot points and use these as a guide to execute their intraday position.
Outllok for ETH/USD
- Long-term: bearish
- Medium-term: neutral
- Short-term: neutral to slightly bullish
LTC/USD
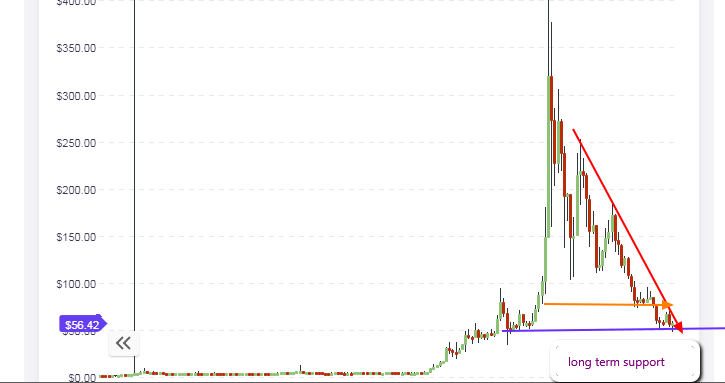
The outlook for LTC/USD has not changed as far as the long term focus is concerned. LTC/USD has come off lows on the long term support line on the weekly chart, with the formation of a pinbar candle. This is indicative that prices will start to push higher. However, the descending trendline resistance is not so far away, and price action will have to break this level for significant upsides to be seen. LTC is being listed for trading on the Gemini exchange in the US. Whether or not this will impact price action will be seen in the coming days.
The hourly charts show prices capped by an intraday resistance line which stretches back several days. Trading on the intraday charts will be limited to price action that moves between the rising support line below, and the descending trendline resistance which will cut across the R2 pivot above at $57.67.
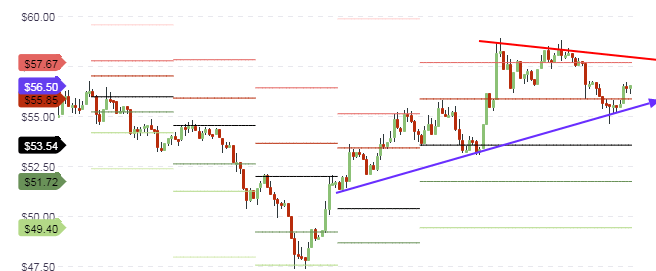
Traders would be looking for a bounce of price action on the R1 pivot line at $55.85 so as to follow prices upwards. This would be the trade setup that would be in tandem with the support bounces seen on the long term and medium term charts. Price action is expected to be capped at the R2 pivot. So pivot trading between R1 and R2 maybe the perfect play for the day.
Outlook for LTC/USD
- Long-term: neutral
- Mid-term: neutral to bullish
- Short-term: neutral


