Have ETH, BCH & BTC Recovered? Not Really: Market Analysis & Trade Paths, Aug 19
Aug 19, 2018, 2:30pm
This is a week of decision for cryptocurrencies. Will Bitcoin, Ethereum and other cryptos show more recovery or will they go back to the dumps?
The recovery that Bitcoin, Ethereum and several altcoins in the market were making earlier in the week has either petered off or have stalled entirely. This is not entirely surprising, given that the recovery spurts we saw earlier this week were caused by some bargain buying at support areas, rather than a true change in market sentiment.
As the crypto markets await key decisions by the U.S. Securities and Exchange Commission (SEC) on a few Bitcoin ETF applications, we will probably see some brief continuation of upside movements, before the market responds in force to the announcements. Traders should be aware of the announcement dates and times and program their trades accordingly so as not to be caught on the wrong side of the tracks.
So what is the outlook for the top 3 cryptocurrencies as we prepare to enter the home stretch in the month of August 2018?
ETH/USD
Ethereum’s recovery from the $280/$290 lows seen early last week seems to have stalled, as the cryptocurrency is finding it difficult to break above the $300 psychological support area. However, this is the last day of the week and the closing price at the end of today will determine what the price action will do.
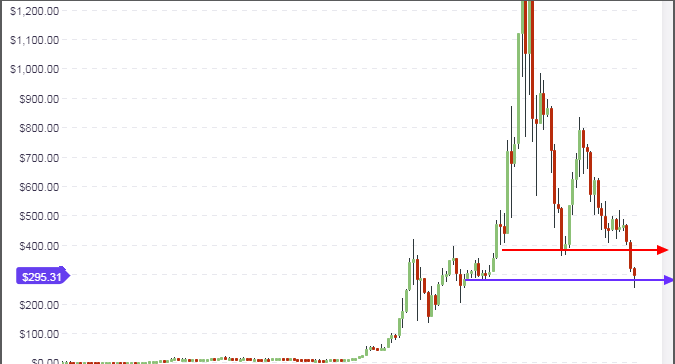
Presently, the weekly candle has transformed into a pinbar, which is sitting at the support line at $290. If the candle ends this way, then the price will, in the long-term, move upwards to the next resistance level, which is found at the previous support area that was broken by last week’s downside. This is the $390 price level. The news from the SEC will play a role in how the weekly candle or next week will look like.
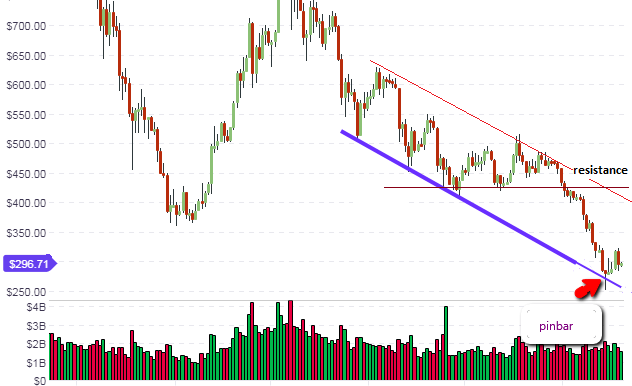
The price action on the daily chart is still contained within the downward channel that was identified in our last analysis. We are already seeing a bounce off the lower channel line, where a pinbar formed after Tuesday’s price action. Pending any surprises, we expect price action to continue in its bounce off the lower channel line. It may take some time for the price to reach the upper channel line as there are many obstacles to cross along the way.
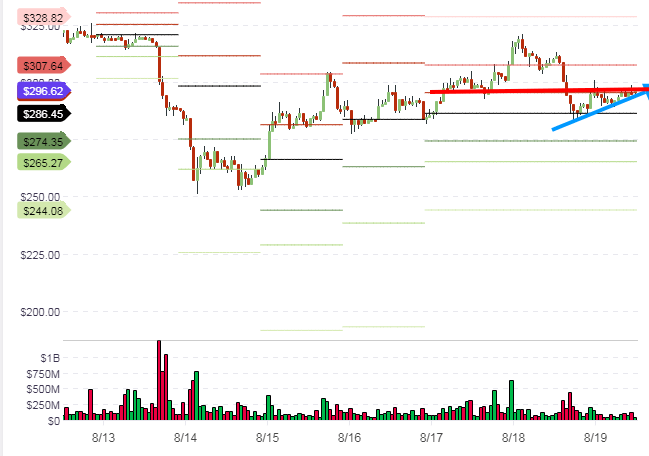
The hourly chart shows price being firmly resisted at the R1 area. This corresponds to a previously broken support at the same area. We also see that the price action is forming higher intraday lows. Therefore, we expect the short-term price movement to be slightly bullish if the R2 pivot is broken to the upside. However, any bullish moves will be limited by the resistance areas lurking not too far away.
Outlook for ETH/USD:
- Long-term – bearish
- Mid-term – bearish
- Short-term – bullish
BTC/USD
BTC/USD’s upward recovery has stalled somewhat. This is also not surprising, as BTC/USD has been seeing lower highs over the last few months. This means that in the long term, BTC/USD will find it harder to hit the previous highs it has made, except some major positive news breaks the present jinx. With some news coming from the US SEC this week on whether some pending Bitcoin ETF applications will be approved or not, this news may just be around the corner.
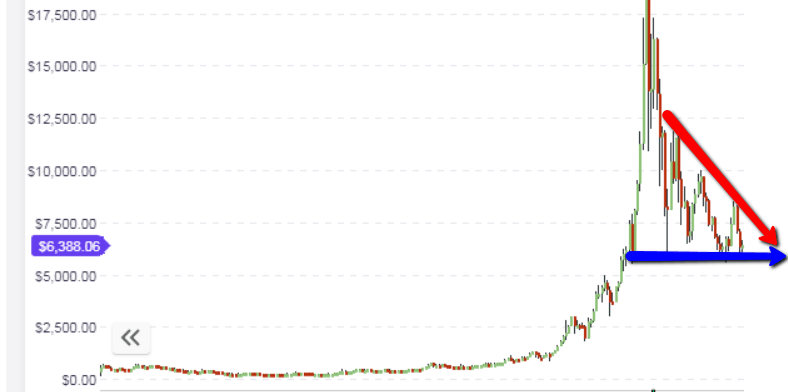
In the meantime, price will continue to oscillate between the ranges found between the support at $5,700 and the descending resistance levels above this area (marked by the descending upper trend line).
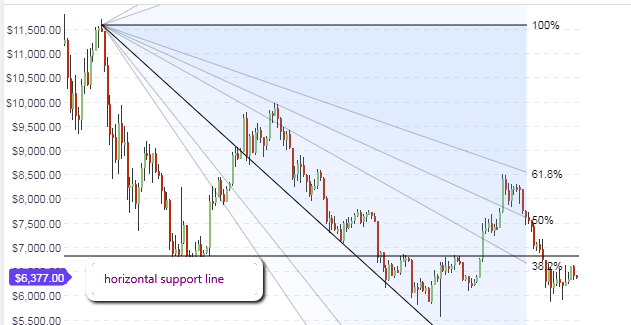
The picture on the daily chart shows that the price action is close to a pending resistance, which is also serving to limit the upside. Again, it will take some positive news in the crypto markets to push prices far enough to break above the resistance areas on the chart. We may see the Fibonacci fan areas becoming significant with any advance. Sentiment is bearish and these areas may serve as areas to sell on rallies, pending the SEC announcement.
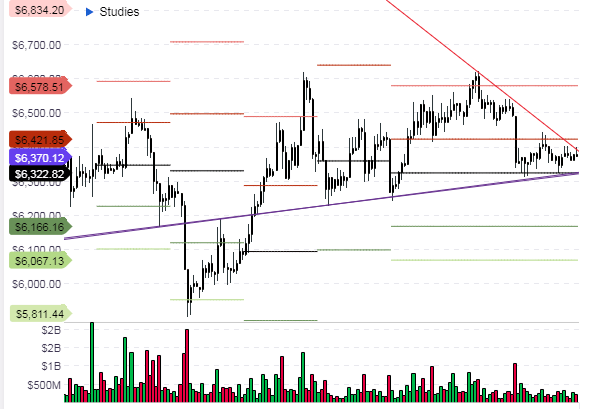
The hourly chart reveals that price action is oscillating between the central pivot below and the R1 pivot above. This may be the trading ranges for the day.
Outlook for BTC/USD
- Long-term: bearish
- Medium-term: bearish
- Short-term: neutral
BCH/USD
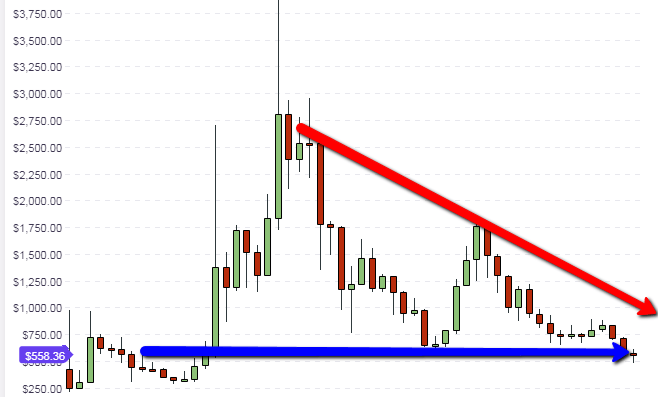
The close of the candle for the day will also mark the close of the weekly candle. This will clearly tell us where the price has closed in relation to the horizontal support line seen on the weekly chart. So we really need to wait for the weekly bar/candle to close over the weekend to know if the support level (blue horizontal line) will hold firm or not, and also to get a picture of the candlestick pattern that will form at that area. We also need to watch for price action on Bitcoin, to which the BCH/USD pair is highly correlated.
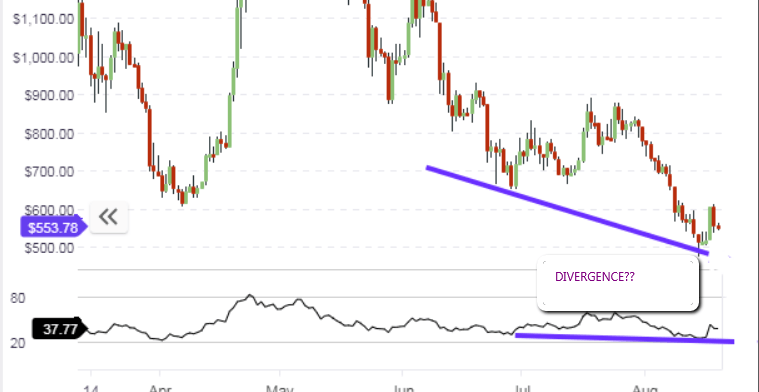
The daily chart shows a divergence between the RSI indicator and the price action. This is a positive divergence, which indicates that there will be some bullish movement on this pair.
On the hourly chart, the price action on the Bitcoin Cash is supported by an upward pointing trendline, but is being resisted at the R2 area. If price is able to break above this R2 area, then there will be some little upside before price gets to the next resistance area at $580.
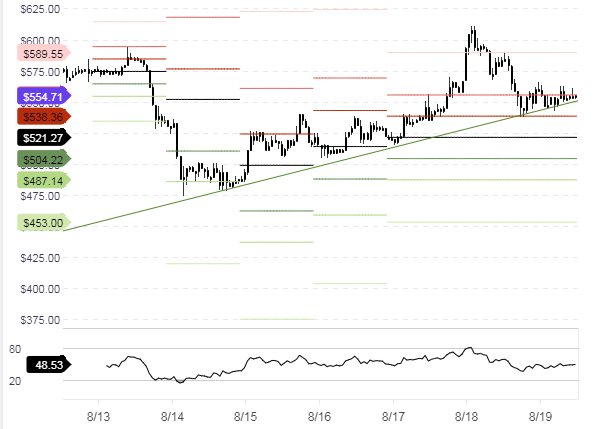
Outlook for BCH/USD
- Long-term: bearish
- Medium-term: bearish
- Short-term: weakly bullish


