
Lacklustre Start to Q4 2018 for Bitcoin and Ethereum: Market Analysis, Oct. 2
Oct 2, 2018, 12:39PMBitcoin, Ethereum & other top cryptocurrencies have had a lacklustre start to the 4th quarter of 2018, with prices trading in very tight ranges
The cryptocurrency market has had a lackluster start to Q4 2018, with light volume trading on Bitcoin and Ethereum. Most of the top cryptocurrencies are trading in very tight ranges, providing very little room for setting up meaningful trades. Ripple is however showing some promise as the Ripple Swell Event enters its second day. Traders are expecting a major announcement from this event concerning Ripple’s xRapid product. This article will therefore provide trade analysis for Bitcoin, Ethereum and Ripple, as we enter the first week of October 2018.
BTC/USD
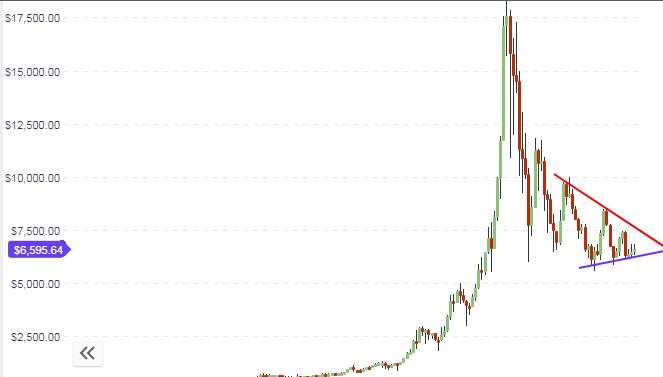
BTC/USD continues to trade at just below the $6,600 mark, representing the top end of the range that the asset has traded in for about two weeks now. As Q4 2018 kicks in, traders of the BTC/USD pair will look to some positive market news in order to get upside impetus. BTC/USD continues to struggle to make any in-roads to the upside. The descending trendline resistance continues to remain at the $7,000 mark. Price action on the weekly chart continues to reflect the identified trading ranges: there is no change to the long term outlook for BTC/USD.
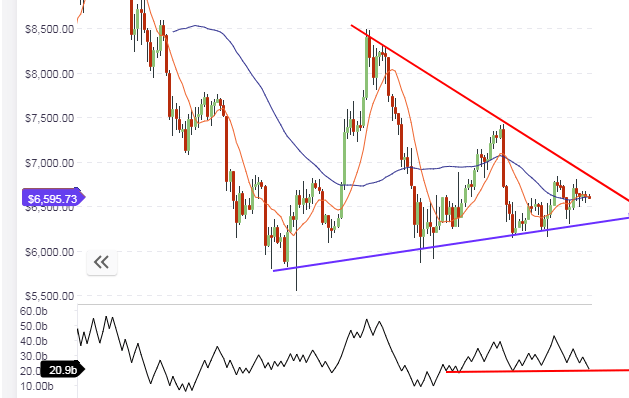
With no change in the long term outlook for BTC/USD, the daily chart will provide some direction as to what direction traders should be looking to trade. The 50-day moving average (blue curved line on the charts) continues to provide support to price action, and we see the 10-day moving average attempting to cross above the 50-day moving average. So far, this cross has not occurred, which is a sign that prices may continue trading within a tight range, at least for the day in view. The ascending support line and descending resistance line continue to be the medium term price floor and ceiling respectively.
A look at the hourly chart shows the situation with the moving averages more clearly. We see that the two moving averages are tangled in a sideways trend, which also mirrors the tight trading range seen on the hourly chart.
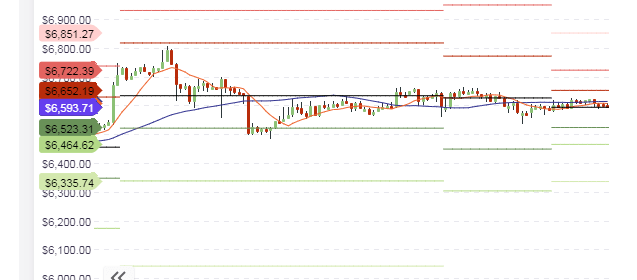
Price action on the intraday charts is locked in a very tight range, with prices finding support at the central pivot. If there is no improvement in the trading volumes for the day, we expect that price will trade within the range provided by the central pivot below, and the S1 pivot above. There is only a $60 price gap between these two pivots, which by Bitcoin’s lofty standards, is not enough distance to support intraday trades.
Outlook for BTC/USD
- Long-term: neutral
- Medium-term: neutral
- Short-term: neutral
ETH/USD
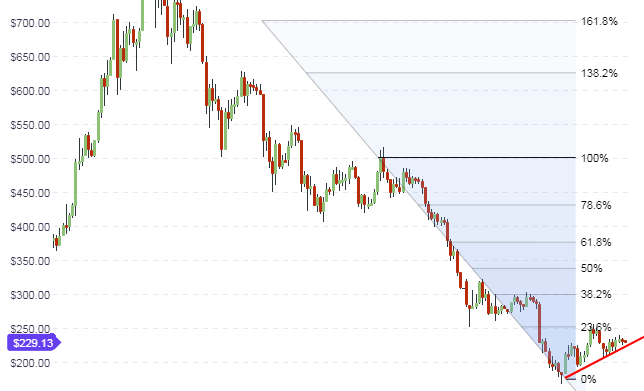
At $229, Ethereum continues to trade above the $190 support level, with price action pushing towards the $290 resistance. However, progress continues to be slow in this regard and Ethereum is also trading in the tight ranges it has traded in for the last two weeks. Ethereum will probably need a push from Bitcoin traders to send the crypto to the upside.
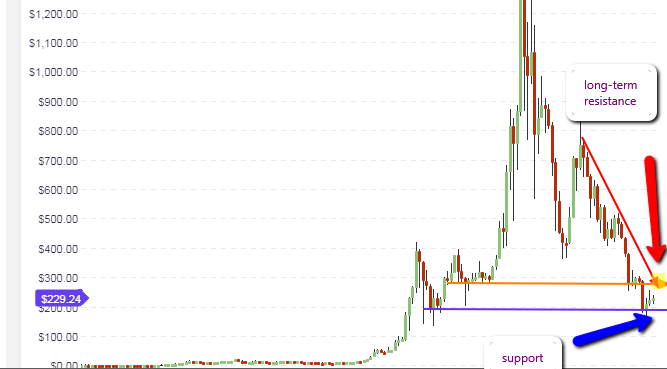
The daily chart continues to show the formation of a bearish flag pattern, with price action now located at the lower end of the flag. The upper trendline of this flag is expected to correspond to the 23.6% Fibonacci retracement line, and this area will act as the resistance to price action. However, if price action breaks above the 23.6% retracement area, then we should see price action moving to the next retracement area at 38.2% Fibo retracement level. This is the level that is located at the $290 long-term resistance area. If price, however, fails to break above the 23.6% retracement area, then price action will head downwards to the flag’s support trendline to test it. If this area is broken to the downside, then we will see a resumption of the downward move to re-test the $190 support area.
For day traders, it is pertinent to state that Ethereum is finding resistance at the central pivot price of $233. We can see the descending intraday trendline resistance reinforcing this area as the resistance to beat. With price pushing downwards from this area, it is expected that intraday support will either come from the S1 pivot line, or it will come from yesterday’s central pivot price area.
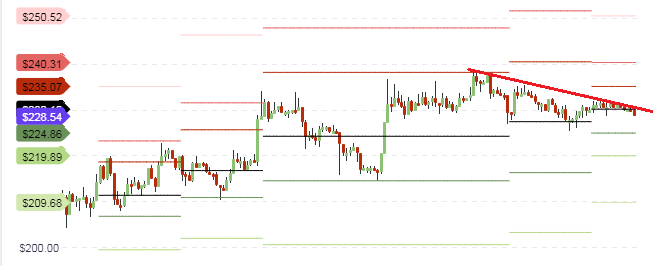
Traders should continue to look towards these key areas as places to set intraday trades. It must be stated that the trading ranges are quite thin, therefore traders must carefully check to see if the potential rewards for these trades are at least two times the risk settings to be applied in terms of the stop loss price settings.
Outlook for ETH/USD
- Long-term: neutral
- Medium-term: neutral
- Short-term: neutral
XRP/USD
XRP/USD has been one of the standout performers in the cryptocurrency market in the last two weeks. After staging a strong upside breakout in the week ended September 23, 2018, prices retreated to the broken resistance levels. However, the week ended September 30 saw the formation of a pinbar with a long lower shadow, showing that bulls had resisted any further downside. Price action on the weekly chart now shows a battle to see if the upside price moves can be sustained, even as the Ripple Swell Event holds in San Francisco between October 1-2.
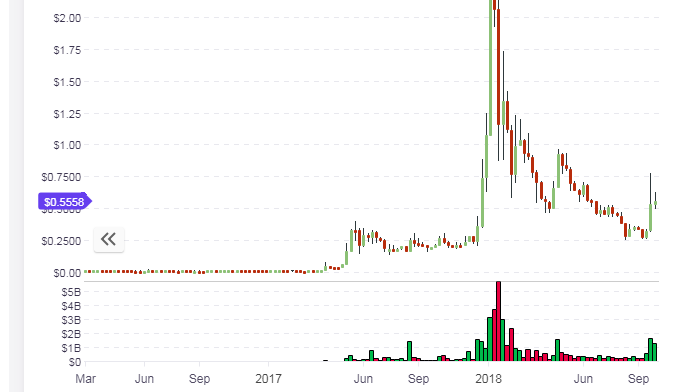
The daily chart shows the price levels that are under consideration. We see the formation of a symmetrical triangle, with price action for the day pushing against the support line. This support line marks the area of previous tests, and is expected to hold firm. Failure of this support line to hold will see price action push downwards once more to just above the 50 cents mark initially, or below this to the 45 cents price area.
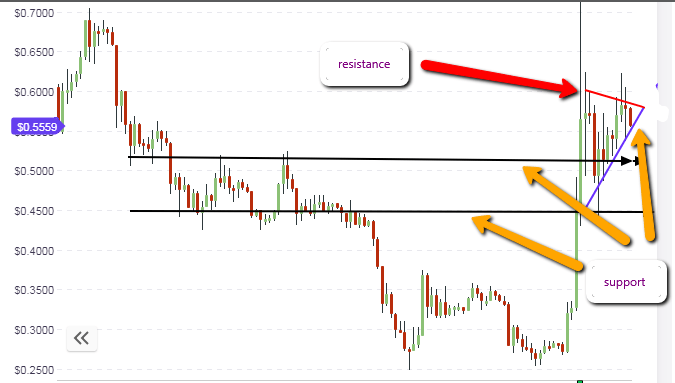
If the support line holds and price action is given an upside push from positive news from the Swell Event, then we will see the symmetrical triangle broken to the upside. The upside move will then need to break the resistance mark formed by the breakout price high of two weeks ago at 80 cents, for the price of Ripple to be in a full-fledged bullish move.
The intraday charts reveal that intraday resistance is expected at the central pivot price of 57 cents, and support is expected to be provided at the S1 pivot line of 52 cents. Price action is expected to trade within this range for the day.
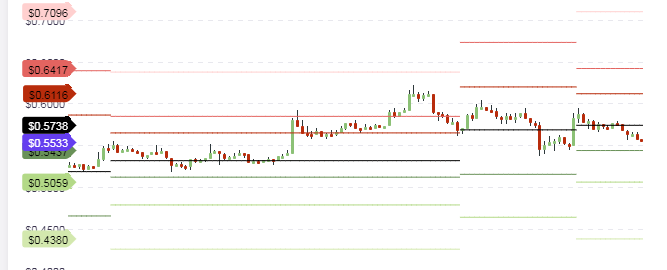
It must be mentioned that a break of the central pivot above, or of the S1 pivot below, will see price action pushing to the next available pivots along the direction of the price moves.
Outlook for XRP/USD
- Long-term: bullish
- Mideium-term: neutral
- Short-term: neutral
Disclaimer: information contained herein is provided without considering your personal circumstances, therefore should not be construed as financial advice, investment recommendation or an offer of, or solicitation for, any transactions in cryptocurrencies.


