Possible Trade Setups for BTC, BCH, ETH, LTC, EOS and XLM: July 26, 2018
Jul 26, 2018, 11:07AMThe general mood in the trading market is positive, despite SEC's decision to delay verdict on Bitcoin ETFs. Stellar prices are looking good.
The trading week is gradually inching to an end, in what can be described as the best week that the top cryptocurrencies have had in a very long while. All this is coming on the back of positive news in the market, one of which was the long-awaited decision regarding five Bitcoin Exchange Traded Funds. The SEC, however, delayed its announcement on five Bitcoin ETF applications until September 2018. While this delay announcement has put a little bit of a dampener on prices, the general mood in the market is positive.
Why are Bitcoin ETFs such a big deal? All these years, there has been virtually zero institutional involvement in the trading of Bitcoin and other cryptocurrencies on exchanges. If the Bitcoin ETFs are approved, this will mark a turning point in the cryptocurrency market and will change the way cryptos are traded forever. Unlike the various unregulated exchanges offering direct trading of cryptos, Bitcoin ETF issuers will be regulated entities, providing insurance, advanced security and a transparent, regulated environment for trading; something that the institutional trading firms like to see before committing the huge funds they trade with.
The anticipation is driving investors back into Bitcoin and other top cryptos. So what is the outlook heading into the last weekend of July 2018?
BTC/USD
The $8,000 mark was identified as a potential psychological resistance. Well, that mark has been decisively broken, paving the way for the next major resistance at around the $8,800 to $9,000 area. However, there are some interesting scenarios that must be pointed out.
Looking at the long-term focus, price is presently at the minor resistance area at point Y, which is at the $8,500 mark. This is not surprising, as some exchanges have this price point as a resistance area, due to the price differential that exists presently from exchange to exchange. But there is also a rising support line which has held back the price action at point X. The dilemma here is whether the price will be forced down below X, or will it head upwards above Y? This will be resolved as we head into the weekend.
![]()
But for today, the intraday chart which we see above is showing that price has broken above the daily pivot at a price of $8,251.69, with a slight pullback which has been truncated at the broken pivot to form a pinbar. At the same area, price is being supported by a rising trend line.
With the minor resistance identified at point Y on the daily chart coming in at $8,500, and the R1 pivot located at the $8,428.74 mark, conditions favor a short upside move from the pivot point to the R1 pivot at the very least. But this move has to be supported by good buying volumes, which are presently quite thin. Traders wishing to trade this setup must pay careful attention to the key levels identified.
ETH/USD
A look at the daily charts will show that ETH/USD continues to trade within the upward channel earlier identified in our previous analyses for this pair. Unless there is a decisive break of the upper channel line, we will continue to see ETH/USD bound by this channel for some days to come. Therefore, any intraday trades must continue to have the bigger picture in mind.
The outlook for intraday trading will continue to focus on the daily support and resistance areas as identified by the pivot points. There is a support trendline, which provided an impetus for a bounce of price on the daily pivot.
![]()
This move has been resisted at least three times at the R1 pivot. At this stage, it is a better idea to wait for either the R1 to be broken for an upside move to R2, or to allow prices to retreat to the blue support line and see if there is sufficient evidence for another bounce trade, which will make another renewed attempt at breaking R1.
BCH/USD
The investigation by Coinbase on the alleged insider trading that trailed its listing of Bitcoin Cash earlier in the year is over, with the company absolving its staff of any wrongdoing. This seems to have provided some upside impetus to the BCH/USD pair, as it is vigorously chasing the $908 resistance level.
However, the price action, which has found itself in an upward channel, continues to be resisted by the upper channel line, which itself is a little below the major resistance level of $908. This has continued to hold back BCH/USD from making further in-roads to the upside.
With this in mind, we take a look at the intraday chart, which is nearing a price support that coincides with the rising support trendline as well as the daily pivot line.
![]()
If the price is able to dip to the support areas identified above we may see a nice bounce which will have a limited upside move as we expect the major resistance to be tested before being broken.
LTC/USD
LTC/USD continues to find itself in the upward price channel that was previously identified on the daily chart in our last analysis. The price action, which had shown signs of embarking on a bullish move, has taken a bit of a breather. However, it is still trading higher than it started the week. The price action would need a decisive closing penetration of the upper channel line, in order to make the push to the nearest resistance area.
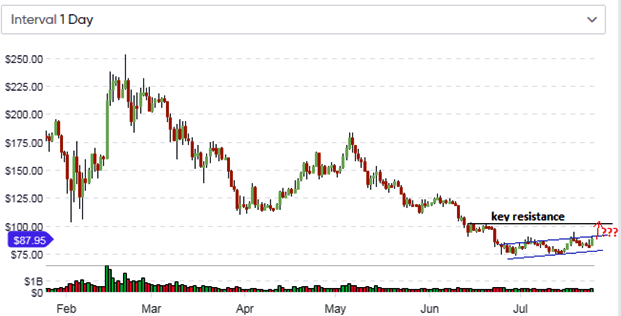
The hourly chart shows that the price action is presently testing the daily pivot area at $87.57. It would need to break above this level to make any further advances, possibly to the R2 area. However, upside potential is quite limited, especially with the $100 major resistance level already in the horizon.
EOS/USD
The outlook for the EOS/USD pair remains unchanged. The price is still contained within the boundaries of the symmetrical triangle form the boundaries on which the EOS/USD price action will find itself until a resolution of the pattern is achieved.
At the level of the intraday charts, price is presently in a no man’s land. The rising trendline, which crosses the daily pivot support line, would be a valid tool for fashioning out a dip-buying opportunity.
![]()
Any long trades may therefore need to wait until prices dip to this level.
XLM/USD
The price of Stellar Lumens has been doing quite well this week. Up from a low of $0.17 in June 2018, the price of XLM/USD has increased by about 40% since then on the back of increased trading on the Binance exchange, the new listing by Huobi exchange, and the Stellar Foundation’s recent certification by the Sharia Review Bureau, which will allow its use in financial products that are Sharia-compliant. This will allow increased adoption of XLM in the Middle East and South East Asia.
The daily chart shows that XLM/USD is well on the upside, with a potential for more upward movement, at least until the resistance line which comes over the $0.45 mark. There is still a long way to go before XLM gets to this level, but with the upbeat mood of investors and the increased demand, there is little standing in the way of Stellar Lumens getting there.
However, much of the activity now will focus on intraday setups, with traders looking for an opportunity to buy on price dips. Presently, the price action is pushing hard against the R1 intraday pivot, buoyed by the steep upward sloping support line.
![]()
Traders should watch to see if the R1 can be broken decisively. Remember that the bias is bullish, so selling is not advocated. Follow the trend, and wait for either a break of R1, or a retreat of price to the slanting support line or the central pivot for a buying opportunity. Volume information is important and should not be disregarded.
Disclaimer: information contained herein is provided without considering your personal circumstances, therefore should not be construed as financial advice, investment recommendation or an offer of, or solicitation for, any transactions in cryptocurrencies.
Advertising