Bitcoin and Ethereum Still Struggling to Make Significant Upside Moves
Sep 11, 2018, 5:51pm
Bitcoin and Ethereum prices continue to remain within a tight range, as bulls struggle to exert influence on the market.
As expected, the selloff in the major cryptocurrencies has cooled off, with prices hitting their expected support levels. There are some new developments in the market, with the Winklevoss twins launching their Ethereum-based stable token to be known as the Gemini Dollar (GUSD). There is also some noise around the SEC’s suspension of trading of two Bitcoin-related products. So what price movements are expected in the top cryptos heading into the middle of the 2nd week of September 2018?
BTC
Bitcoin continues on a slow path to the upside, as it struggles to make further inroads within the context of the identified upside and downside price borders. Unlike the last two price recovery schedules, BTC is finding it quite hard to sustain the upside recovery, and has been stuck between the $6,200 and $6,350 range for the past two days. However, price is still expected to push higher to reach the resistance area marked by the descending trendline on the chart below. However, this move may take some time to evolve.
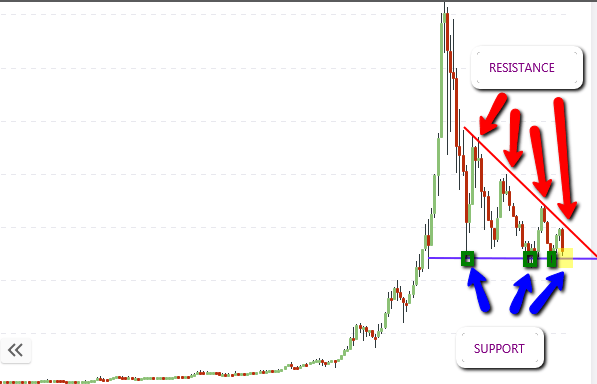
The daily chart does not provide much new information, so we will get down to the hourly chart, where we see price action trading in a very tight range between the central pivot below ($6,300) and the R1 pivot resistance at $6,400.
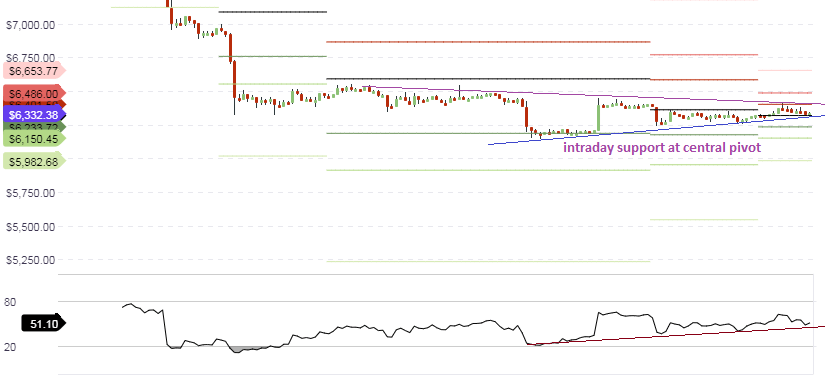
If there is not much market-moving news today then we may see prices trading within this range for another day. However, if there is a break of the price bars above these identified levels, then we will see prices moving in the breakout direction. If prices head lower, this will present new buying opportunities, and this will manifest in the form of a price dip, followed by a bounce. On the other hand, it is possible that the price may break above the R1 pivot, and this will then serve as a continuation of price recovery, up until the descending trendline resistance.
Market sentiment for BTC:
- Long-term: bearish
- Medium-term: neutral
- Short-term: neutral
ETH
ETH continues to struggle to find support at the $190 area. It had dipped as low as $184 in yesterday’s trading but has since come off those lows. ETH/USD simply needs to find some degree of support first, before it can start to make any upside recovery. Currently, the weekly candle sits at just above the support mark at $194. If this support level is not broken to the downside by the end of the week, then ETH/USD may experience some price recovery, pushing to the next resistance area at $290 (the orange line, which was a previous support that ended up being broken).
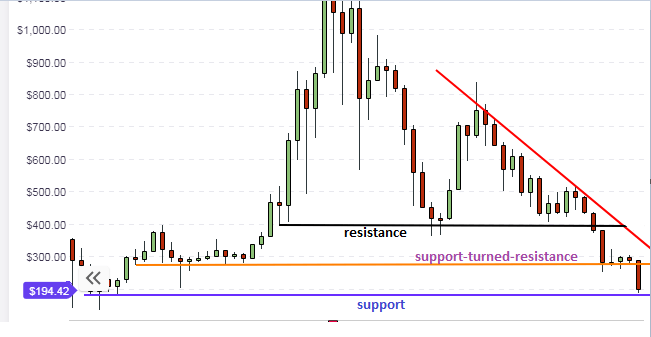
The daily chart reveals that the price action, which was still pushing towards the lower channel line of the downward channel at our last analysis on Sunday, has succeeded in making it to the lower channel line.
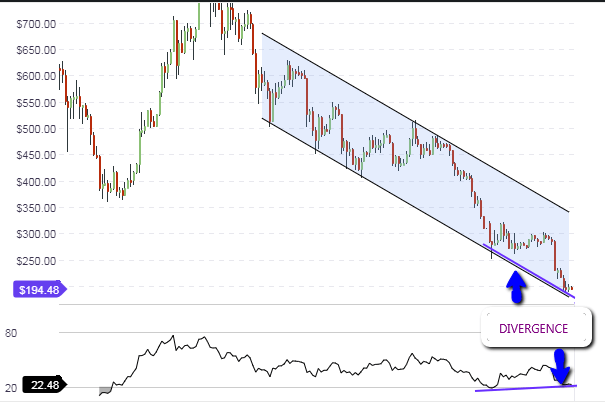
This lower channel line will serve as a support for price action in the medium term. If the weekly candle mentioned above succeeds in holding out at support, then we may see price action bouncing off the lower channel line in the week to come. Also, there is the possibility of a positive divergence occurring, as the RSI has started to show two successively higher lows even as the price is forming lower lows.
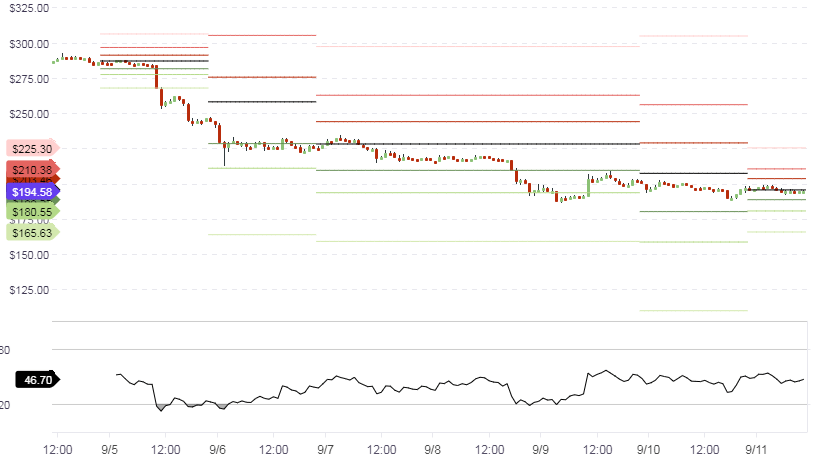
The hourly chart shows that the price continues to trade within very narrow ranges. The price is basically dancing around the central pivot, with no clear bias. The trading range is only suitable for scalp trades, which will require the trader dropping the time period of the charts to 15 minutes or even 5 minutes, in order to be able to trade the limited price movements.
Market sentiment for ETH:
- Long-term: bearish
- Medium-term: neutral
- Short-term: neutral
XLM
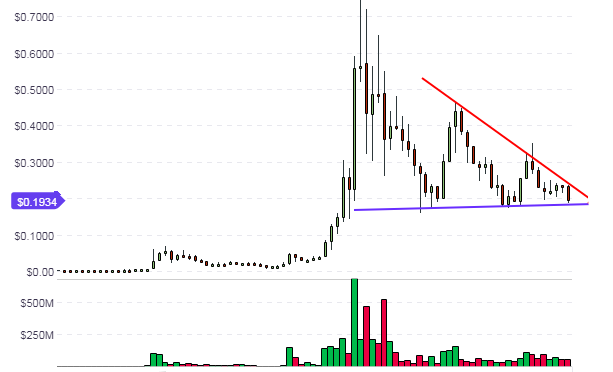
Stellar Lumens has found support on the weekly chart, as seen below, and is presently trading at the $0.1934 price level, after making some overnight gains.
The picture on the hourly chart shows that the price action is currently trading in a tight range between the central pivot at $0.1906 and the R1 pivot above at $0.1958.
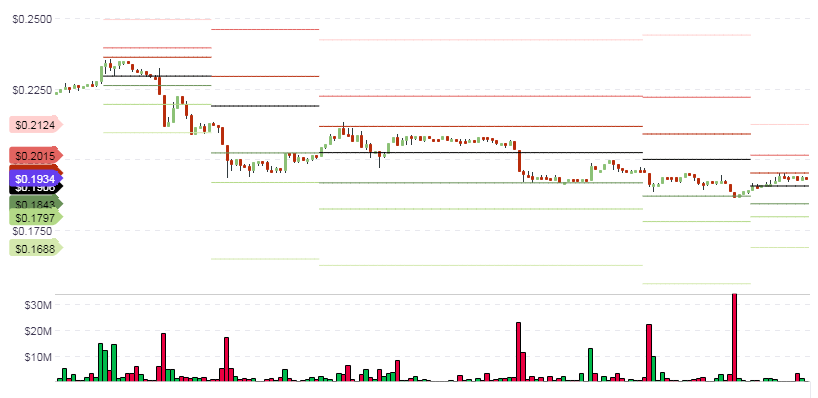
We need to see price action close above the R1 pivot for further upside to continue, possibly to the R2 pivot at the price level of $0.2015. It is possible that price action may bounce off the central pivot before this will occur, as this level has proven to be a strong intraday support.
Market Sentiment for XLM
- Long-Term – neutral
- Medium-term – neutral
- Short-term – bullish


