Negative Bias Persists for Most Cryptocurrencies Today: Market Analysis July 12, 2018
Jul 12, 2018, 9:23AMTop 10 coins are expected to head down going into the weekend as bearish sentiment sweeps through the cryptocurrency market.
As predicted earlier this week, Bitcoin traded lower, breaking the $6,374 minor resistance and is effectively trading lower at this point. The negative bias for most of the cryptocurrencies has persisted, and any upsides will be reliant on some buying pressure towards the lower ends of the trading ranges identified Tuesday.
There is a large wave of bearish sentiment sweeping through the cryptocurrency market, and it is expected that most of the top 10 cryptos will head down south, heading into the weekend. Traders are likely to position themselves to take the trades as identified in the trade analysis for the day below.
What can traders expect to see on the charts of the top 8 cryptocurrencies for the day?
BTC/USD
For Bitcoin, the bias for the day remains firmly bearish. Having broken Tuesday’s minor resistance of $6,374, the price action for Bitcoin will be making a push towards the S3 support pivot for the day at $6,120. If this level is violated, expect the price of Bitcoin to push towards the psychological support level of $6,000. Incidentally, a trendline drawn on the daily chart and H4 chart for BTC/USD shows a support line which connects the two previous lows of the last three weeks and is expected to serve as support for the current price action at $6,005. At this point, it is possible to have a short term buy rally just as has been seen in the last three weeks, downside to the $5,500 mark has been shaken off by bargain buyers.
As previously identified, most of Bitcoin trading activity has been confined to a range. It is therefore expected that trading will occur within the range for some time to come. Presently, we are getting to the floor of that range.
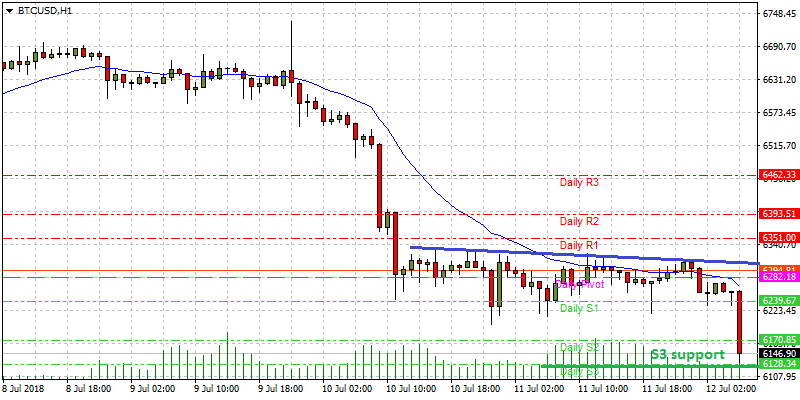
Intraday price movement for BTC/USD is capped at the intraday resistance line (shown in blue) at $6,384. Price is at the S3 support. If S3 holds firm, price will trade between $6,128 to the intraday support line. A break of the S3 support will see further downside.
ETH/USD
The ETH/USD pair confirmed the downside move from the rising wedge seen on Tuesday’s charts to head down from the $465 price level. However, downside move has not been as potent as was seen on Bitcoin.
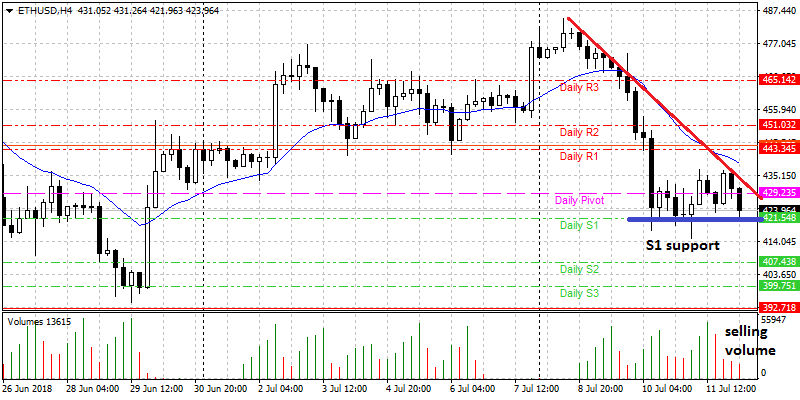
As is seen on the ETH/USD H4 chart, downside move on ETH/USD has stalled at the intraday pivot support on S1 located at $421.54. However, there is a strong resistance trendline which has firmly resisted any upside price moves for several days now. This is expected to put the S1 support under intense pressure for the day.
We expect the bearish move on the ETH/USD pair to continue, with price breaking the S1 support level. If the S1 level is broken to the downside, then the price will push for the intraday S2 support at $407. If the selling volume increases on the break of S1, expect the price to push hard to S2.
XRP/USD
Ripple’s woes continue, with the bearish move extending. We have identified the trading range for Ripple to have a floor of $0.39, and the price action seems to be heading towards this floor.
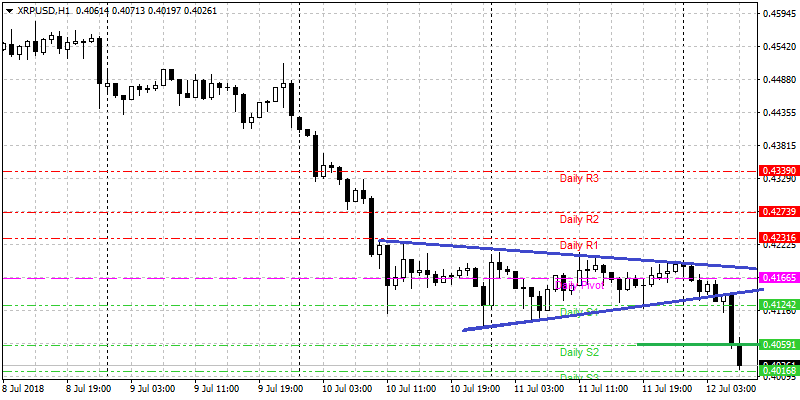
The intraday pivot S1 support of $0.4059 has been broken and price is already at the S2 support. This support level is under pressure and a break of this level will see price pushing for the major support of $0.39. Expect the bearish sentiment on the XRP/USD pair to continue, as the parent company battles to restore confidence in this crypto and resolve the pending class action suits it is currently facing.
BCH/USD
Bitcoin Cash has broken below the descending triangle pattern seen on the daily chart earlier in the week. However, its downside move is expected to be a slow and steady one.
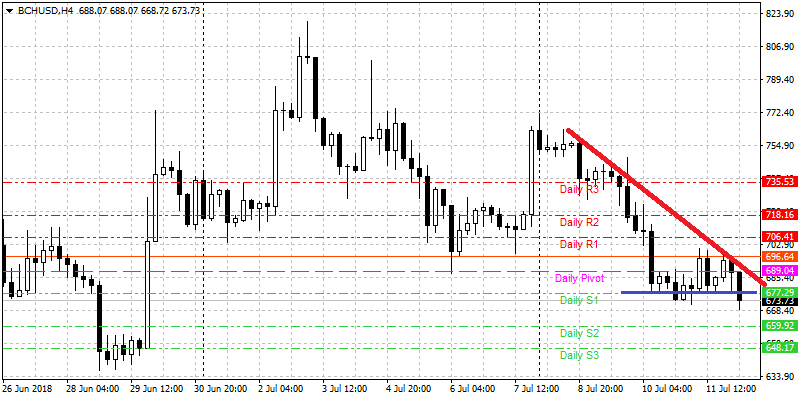
As is seen on the H4 chart for Thursday July 12, 2018, the S1 support has been breached, but the breakout below this intraday support line is yet to be confirmed. If the breakout below the S1 support is confirmed, price is expected to push to the intraday S2 support at $659. We expect the bearish sentiment on the BCH/USD to continue till the end of the week, at which time the market situation will determine further price action.
LTC/USD
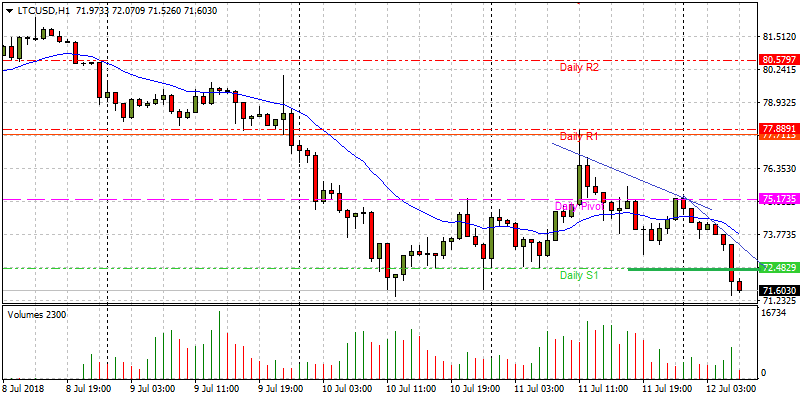
Litecoin has seen a break of its intraday S1 support level and is expected to push towards the S2 support area.
The H4 chart also shows a symmetrical triangle pattern which has been breached to the downside.
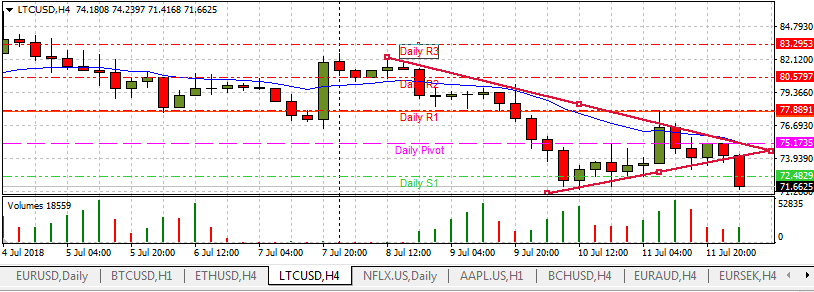
The bias for LTC/USD remains bearish, and price is expected to push to the intraday S2 support level at $68.
EOS/USD
As predicted earlier, there is a strong bearish sentiment on EOS/USD. The previous support level of $7.51 has broken down and the price has pushed down hard. The weekly chart for EOS/USD, which was shown to have a strong support trend line in our last analysis, has now revealed that the support trendline has been breached, even though the breakout has not been confirmed.
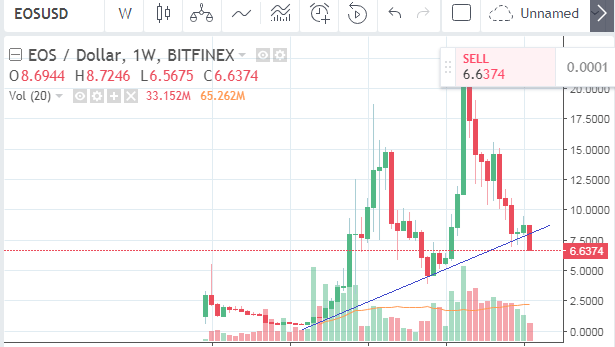
The bias for the EOS/USD pair is now confirmed to be strongly bearish. A look at the H1 chart shows that the intraday support level at $6.83 has been broken and price is pushing down to the next support area at $5.60.
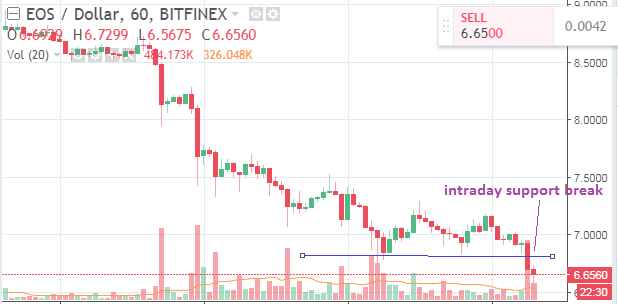
There might be a slight upward retracement to the broken support level before the downside resumes.
IOTA/USD
IOTA/USD is now at the weekly support price of $0.94. This support is expected to hold firm, as it has been tested several times in the last one week. Price behavior by buyers, sellers and uncommitted traders at this level will determine whether a brief upside rally will be seen, or whether this support line will be broken.
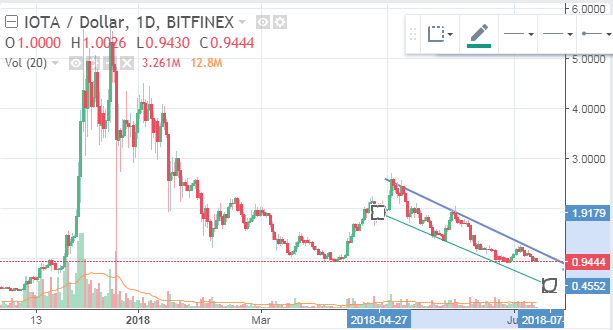
However, the daily chart shows that the price action is presently in a down channel. A break of this strong support line will see the price of IOTA/USD heading to the channel line, which may intercept price at $0.4552. But be aware that this price move will not occur in a fell swoop; it may take some time to get there.
If the support level holds firm, expect a brief rally that will be capped by the upper trend line that forms the upper border of the channel shown in the chart. This move should be watched closely.
ADA/USD
Cardano is in the middle of a bearish move. However, it is also stuck in a down channel with price pushing towards the channel line.
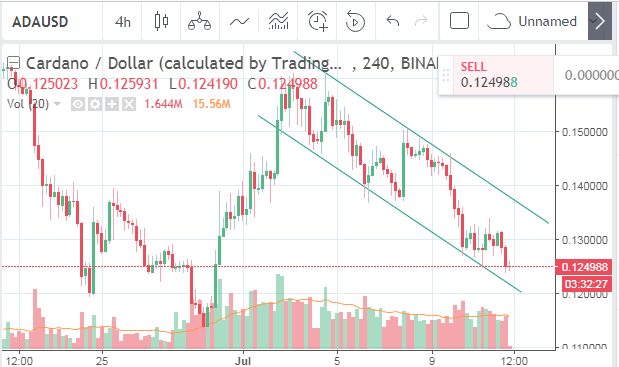
Even though the asset is in a downtrend and there is selling pressure as seen on the volume indicator, it is unclear at this time whether price will rally from here or not. It is presently too risky to apply an intraday trade to this asset at the moment. The best bet is for traders to wait until the price hits the channel line at a price range of $0.12 to $0.1230. The behavior of the price at the channel line will determine the next move. If the channel line remains firm, then a short term rally is expected. If the channel line is broken, the ADA/USD pair has room to proceed to chase the next major support at the $0.115 level.
Disclaimer: information contained herein is provided without considering your personal circumstances, therefore should not be construed as financial advice, investment recommendation or an offer of, or solicitation for, any transactions in cryptocurrencies.


