SEC’s Reconsidering Cheers BTC Up But Will It Last? ETH, BCH: Market Analysis Aug 26
Aug 26, 2018, 2:27pm
Bitcoin prices seem to be on the upswing, but will this last? Read on to find out how to trade Bitcoin prices for the week.
Thursday, August 24 saw the SEC declaring that its 4 commissioners would review the decision made earlier in the week by its staff to decline 9 Bitcoin ETF applications. This announcement seemed to provide some bit of cheer to the cryptocurrency market, with some of the major cryptos experiencing a rebound from the lows of Wednesday.
So what does the last week of August 2018 hold for the cryptocurrency market?
BTC/USD
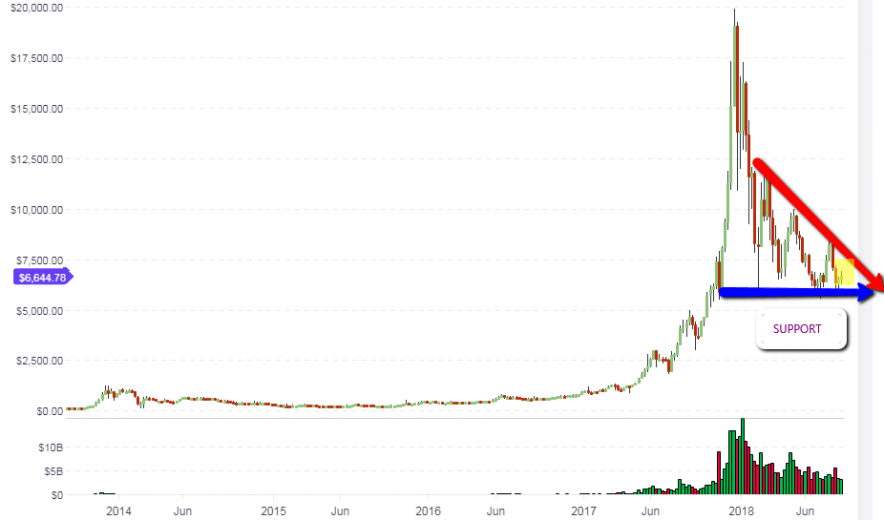
The outlook on the weekly long term chart for BTC/USD remains unchanged. The news from the SEC on the review of the declined Bitcoin ETF applications provided some impetus for a bounce off the recognized long term support. Bitcoin is now trading at a little above $6,650. The price action still has further room to make some gains and any new announcements from the SEC that favor the Bitcoin ETF applications will provide great impetus for the pair to keep moving up.
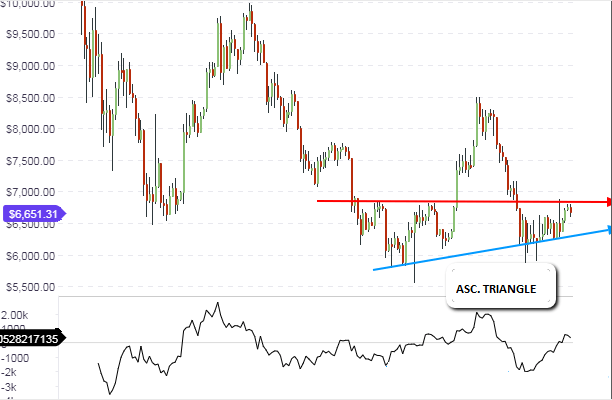
The daily chart shows that the price action is presently pushing against a daily resistance level that has formed in the course of several weeks. With a rising support trendline, the ascending triangle so formed gives some hope for further uptrending movements. However, the price action has to push above the minor resistance level at $6,800 for us to see further uptrend. We should please take note that the long term weekly resistance level is a downward sloping trend line, which may limit upside technically at these levels. BTC/USD will need some strong positive news to break above the resistance levels at $6,800 as well as the long term resistance trend line.
The intraday hourly chart shows that the price action has found support at the R2 pivot level ($6,659). We see this support being validated by the presence of an intraday support line, which is the same support line that forms the lower border of the ascending triangle on the BTC/USD daily chart. It is therefore believed that BTC/USD has some upside momentum for the day, but will be limited by the red resistance line, which is the continuation of the long term resistance line seen on the weekly chart
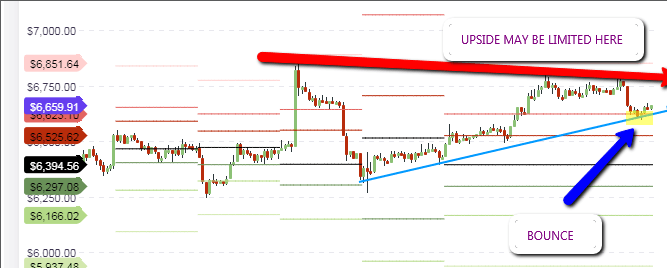
As indicated, contrarian intraday traders can decide to trade brief long positions off the identified pivot support area, but must exit such positions at the identified resistance line hanging above. Those who prefer to follow the trend can decide to wait and sell on the rally of the price to the resistance area.
Outlook for BTC/USD
- Long-term: bearish
- Medium-term: neutral
- Short-term: mildly bullish
ETH/USD
The weekly chart for ETH/USD shows that the weekly bar/candle seems to have found support at the identified horizontal support line at $280/$290. It has tested this line all week long and has been unable to break it. Therefore, if the day closes without breaking below this line, it is likely that ETH/USD may have to endure further tests of this area, or may have a rebound from there. So far, there isn’t much happening fundamentally to change the bearish outlook for ETH/USD.
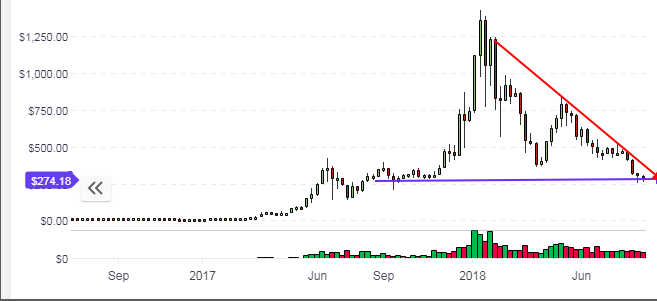
Long term bulls on ETH/USD may decide to acquire some of the asset at this area, for use in long term appreciation holds or for use in participation in future ICO projects. However, the downward sloping resistance line may limit any upsides in the near term, until some strong positive news that will boost the cryptocurrency market hits the newswires.
The intraday charts reveal an interesting picture. The price action is presently bouncing off the medium term support line, which is also where the central pivot is located. This is at the $271 price area. Expect this support line to be tested a few more times. If we see some bullish start to the week for the cryptocurrency market, then the price of ETH/USD will be dragged upwards from this support area.
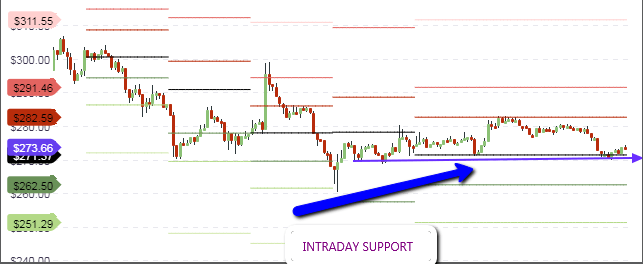
The trade play for the day would be therefore to trade within the range of prices located between the central pivot at $271, and the R1 pivot above this at $282.59. We have a perfect setup for a range trade today, so traders can also decide to add an oscillator like the Stochastics or the Relative Strength Index (RSI) indicators, to provide guidance as to when prices are at support/oversold levels, and when prices are at the R1 pivot at overbought indicator areas.
Outlook for ETH/USD
- Long-term – bearish
- Mid-term – bearish
- Short-term – neutral
BCH/USD
What does the long term weekly chart on BCH/USD indicate? We can see that the price action has continued to be found at the long term support area located at the $520 mark. The identified ranges for support and resistance continue to be the horizontal support line and the downward sloping resistance line.
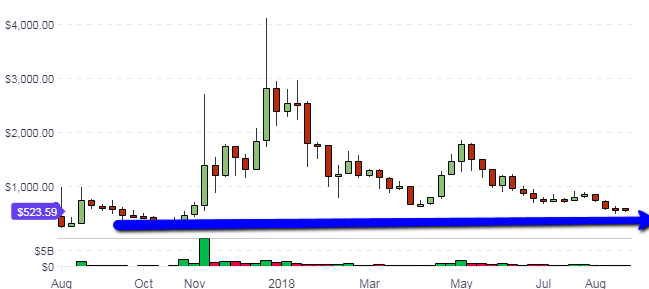
As long as there is no fundamental change to the market sentiment for BCH/USD, these ranges will continue to form the borders for the price movements long term. We will continue to see price bouncing off the support line, and rallying to the resistance line where the bears will sell on the rallies to force prices back down to the support line.
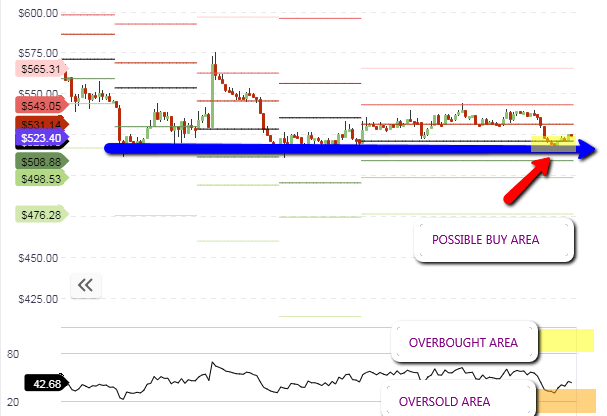
Intraday, we see that the price action is trading on a bounce off the central pivot at $523.40. The intraday resistance for BCH/USD is found at the R2 pivot, which is located at the $543 price level. We expect these pivots to serve as the trading range for the day. Therefore, the addition of an oscillator to identify overbought and oversold levels will aid the trader in making sound range trading decisions.
Outlook for BCH/USD
- Long-term: bearish
- Medium-term: neutral
- Short-term: neutral to bullish


