Visualizing Cryptocurrency: New Ways of Representing Blockchain Activity
Jul 27, 2019, 3:34pm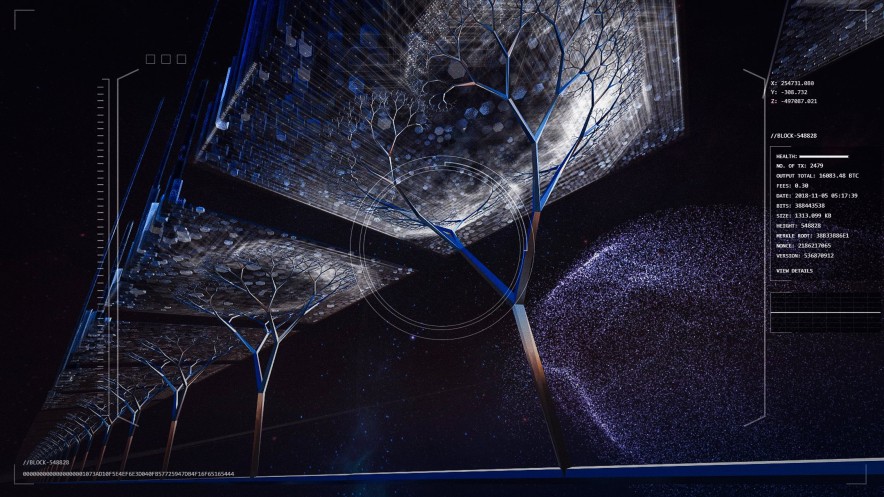


Blockchains are always active, but it's hard to see that in a tangible way. Which websites allow us to see blockchain activity in a new light?
If you’ve ever looked up a Bitcoin transaction, you’ve probably used standard block explorers, which display very simple transaction records. Block explorers display transaction amounts, timestamps, and other related transaction data in a very straightforward way. However, some web apps are now providing more elaborate representations of blockchain activity―here are a few sites to check out.
IOHK Symphony
![]()
Symphony is a web app that presents Bitcoin transactions in an aesthetically pleasing way: it’s an “immersive journey accessible through your device’s browser,” as IOHK has described it. The name “Symphony” reflects the fact that each on-screen crystal makes a sound based on factors like transaction value, spent outputs, and transaction fees. This is also represented visually, as shown above.
Symphony was developed by IOHK, the company behind the Cardano blockchain, but it actually displays Bitcoin transactions. That said, Ethereum and Cardano transactions are on the way. IOHK is also planning to add support for virtual reality and augmented reality devices, which will make the Symphony experience even more immersive. IOHK plans to take Symphony on tour to exhibit its full potential.
BitBonkers
![]()
BitBonkers is another visualizer that displays Bitcoin transactions in a similar way. It portrays Bitcoin blocks as physical blocks, while transactions are represented as small spheres that drop onto the ground. This puts size at the forefront: block sizes (in kilobytes) correspond with the block that is on your screen, while transaction values (in BTC) correspond with the size of each sphere.
BitBonkers is a little more basic than Symphony: it updates as new blocks are mined, so there is no historical blockchain data. Unfortunately, it doesn’t provide a way to view each transaction in a block explorer. To its credit, BitBonkers is fairly light on the viewer’s system, and all in all, it is quite visually impressive for a hobbyist project.
TxStreet
![]()
There are also some playful ways to see a blockchain in action. TxStreet takes the idea of network traffic literally: it displays Bitcoin and Bitcoin Cash transactions as traffic on a busy street. Individual people represent transactions, and the buses that they step onto represent blocks. When a bus leaves the depot, that means that a new block has been found, and that the transactions are complete.
TxStreet doesn’t give detailed data about most individual transactions, although it does display Bitcoin Cash memos as speech bubbles. The end result is an incredibly intuitive way to see blockchain activity in real-time. It’s also worth noting that TxStreet was based on an earlier blockchain visualizer (txhighway.com) that is somewhat similar.
Google Cloud Datasets
Google Cloud has introduced several crypto datasets over the past few years. This doesn’t give users a way to visualize data directly, but analysts can use data to produce compelling charts and images. For example, Google created the chart below to display the pedigree of collectible CryptoKitties. The size of each dot represents the PageRank of a CryptoKitty―that is, its popularity or “reproductive fitness”:
![]()
Typically, blockchains provide data on a transaction level, but Google Datasets handle data in aggregate. This makes it easier for researchers to perform analytics on blockchain data. This sort of blockchain data is very useful for projects that are building blockchain technologies, and it is also quite handy for enterprises and companies that are using blockchain tech to make important decisions.
Mytchmatik
There’s one more project to look at. Prysmatic Labs is a major contributor to the Ethereum 2.0 ecosystem, and it is building a visualizer called Mytchmatik. Unfortunately, Mytchmatik is still in its early stages and does not have anything to show at the moment. In the meantime, Preston Van Loon and Mytch Kosowski have been actively seeking contributors for the project on social media:
![]()
It seems that Mytchmatik will have several different components built into it. According to Preston Van Loon’s announcement, Mytchmatik will serve as an Ethereum 2.0 visualizer, and it will represent system performance and validator performance. Prysmatic Labs has added that Mytchmatik will also feature a light block explorer, proof-of-stake finality visualizers, and historical data.
Conclusion
Blockchain visualizers provide an interesting way of looking at blockchain activity. They can provide a picture of real-time activity, represent information in aggregate, or simply make everything more aesthetically appealing. More basic block explorers serve a purpose―sometimes, you need to see plain transaction data―but there’s no substitute for ambitious and creative blockchain visualizers.